Versions Compared

Key

  • This line was added.
  • This line was removed.
  • Formatting was changed.

...

Expand
title0007_ABCPerStorePerOperator

Standatd report

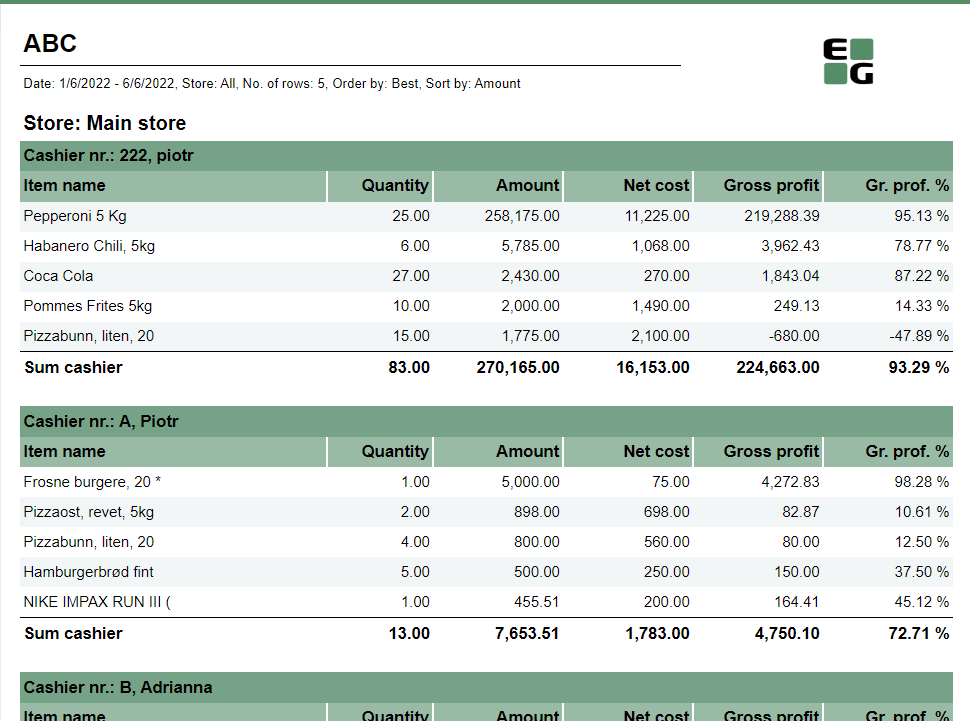
Description:

Report allows to find given number of best or worst selling items per store, per cashier on multiple levels (amount, quantity, net cost, gross profit).

Selections: 

  • Date from: Default today
  • Date to: Default today
  • Retail store: Default all
  • Number of items: Number of best or worst items to display - default 5
  • Sort type: worst or best - report will display given number of worst or best selling items - default best
  • Sort measure: amount/quantity/net cost/gross profit/gross profit % - set the measure on which the items are sorted. - default amount
  • Article group: Default all

Output:

One page per each store. One section per each cashier. Inside the section selected number of best (or worst) selling items for given cashier.

Columns:

  • Qunatity
  • Amount: Sales amount inc. VAT
  • Net Cost
  • Gross profit
  • Gr. profit %: Share of Gross profit in Net amount

Sorting:

  • Selected sort measure

Source:

  • Lindbak POS Reporting cube (OLAP)


Anchor
0010_ABCPerStorePerArticleGroups_std

Expand
title0010_ABCPerStorePerArticleGroups_std

Image Added

Description:

Report allows to find given number of best or worst selling items on multiple levels (amount, quantity, gross profit, etc.) per selected hierarchy level (department,item area, etc.)

Selections: 

  • Date from: Default today
  • Date to: Default today
  • Store: Possible to select one store or all available; default all
  • Profile: Multivalue; default all
  • Department: Multivalue; default all
  • Article area: Multivalue; default all
  • Article group: Multivalue; default all
  • Article subgroup: Multivalue; default all
  • Article identifier: Possible to select Item ID or Model. Only name of column is changed - field is always Item ID
  • Grouping: Selection of hierarchy level for which number of best items will be displayed. Possible selections: Department, Article area, Article group, Article sub group, Store; default Area.
  • Count: Number of best or worst items to display - default 10
  • Sort type - worst or best - report will display given number of worst or best selling items - default best
  • Sort measure - amount/quantity/net cost/gross profit/gross profit % - set the measure on which the items are sorted. - default amount

Output:

Sale statistics for selected number of best or worst items per selected grouping (store or hierarchy level) sorted by selected sort measure with totals on higher levels (e.g. for grouping: article area there are totals for department and store, but for grouping: depratment there will be only total per store)

Columns: 

  • Dept.: Department number
  • Area: Item area number
  • Grp.: Item group number
  • Srg.: Subgroup number
  • EAN
  • Model/ItemID: Article identifier (ItemID - see clarifications)
  • Item name
  • Quantity
  • Amount: Sales amount inc. VAT
  • Net cost
  • Gross profit
  • Gr. prof. %: Share of Gross profit in Net amount

Sorting:

  • Selected sort measure

Source:

  • Lindbak POS Reporting cube (OLAP)
  • Lindbak POS Reporting DW


Anchor
0057_NonsalePerOperator

...