...
| Expand |
|---|
| title | 0250_NewMembersPerStore |
|---|
|
PBI:120761 
Description: Report lists new members per store. Selections: - Loyalty program – Default loyalty program
- Year – Default current year
- Calculate per – Default month
- Period – Default current period
- Date from – Default beginning of the current week
- Date to – Default today
- Team – Default all
- Store – Default all
Output: Report shows list of new members in selected period of time with comparison dates range. Report has a summary for teams and total summary for all teams and stores. Report only list a store if there are sales in at least one of the periods (this period, last period or same period last year). Columns: - Store
- This period/Last period/Same period last year
- Number of customers and new members
- New members %
- New members
Source: - Lindbak POS Reporting Cube (OLAP)
|
...
| Expand |
|---|
| title | 0450_StoreSettlementPerOperator |
|---|
|
CO: 156791. Based on report 0709. 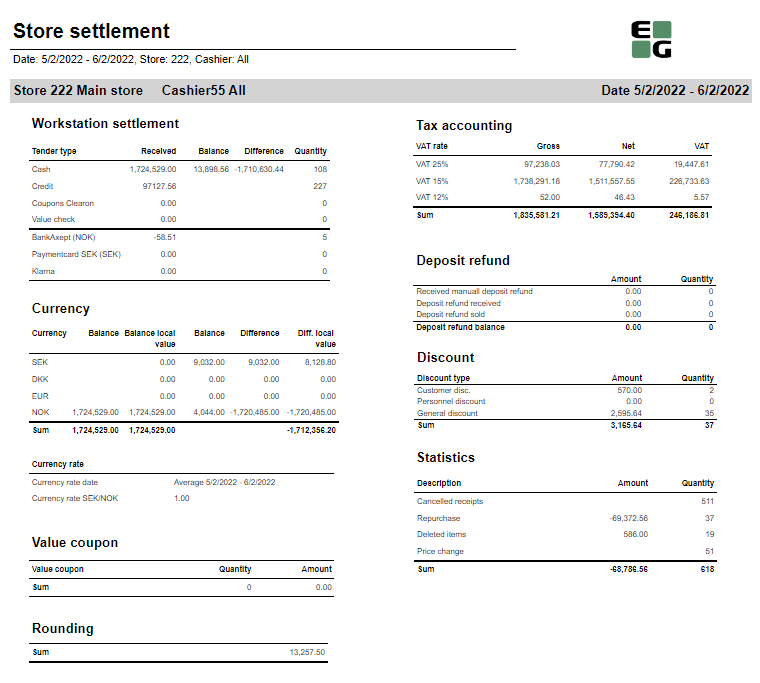
Description: Report allows to follow up store settlement: on first page settlement for all selected cashiers (if all cashiers are selected it equals whole store settlement) and settlement per each cashier on following pages. Report is divided in 9 subreports which will be descriped separatly below. Selections (applies to all subreports): - Date from - Default today
- Date to - Default today
- Store - Default select single store
- Operator -Default all
Subreports: | Expand |
|---|
| 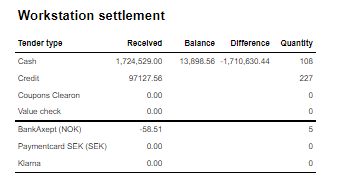
Columns: - Tender type - payment method
- Received - Sales amount inc. VAT received in given tender type
- Balance - Money amount registered in the end of the day (sum for selected operators who made balance and selected days)
- Difference - Balance - Received
- Qunatity - Number of items sold in given tender type
Output: One row per one tender type Clarifications: - Balance and Difference make sense only for cash since only cash it's kept in cash register.
|
| Expand |
|---|
| 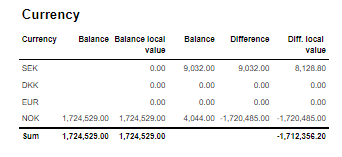
Columns: - Currency
- Balance (Beholdning): Sales amount inc. VAT in main currency
- Balance local value: Sales amount inc. VAT in received currency
- Balance (Oppgjør): Money amount registered in the end of the day in given currency (sum for selected operators who made balance and selected days)
- Difference: Balance (Oppgjør) - Balance (Beholdning)
- Diff. local value: Balance (Money amount registered in the end of the day) in main currency - Balance local value
|
| Expand |
|---|
| title | 1423_subCurrencyRate |
|---|
| 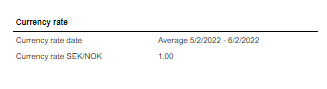
Description: Average currency rate (rigidly set to SEK/NOK) for given period.
|
| Expand |
|---|
| 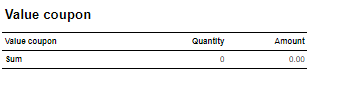
Description: This subreport shows sum sales amount inc. VAT and sales sum quantity for EAN set in hidden parameter: pValueCouponEAN (default: 926)
|
| Expand |
|---|
| 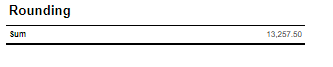
Description: Sum of all transactions subtotal rounding (for given period, store and operators) |
| Expand |
|---|
| 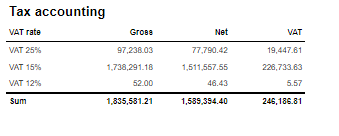
Coumns: - Gross: Sales amount inc. VAT
- Net: Sales net amount
- VAT
Output: One row per sum one type of VAT. Vaules are summed for given store, date period and operators
|
| Expand |
|---|
| title | 1405_subDepositRefound |
|---|
| 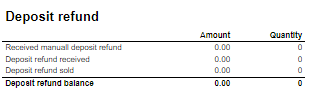
Columns: - Amount: Sales amount inc. VAT
- Qunatity: Number of receipts.
Rows: - Received manuall deposit refund: Amount direction in per item group set in hidden parameter: pArtGrpManualDepositRefundIn (default: 502)
- Deposit refund received: Amount for direction in per item group set in hidden parameter: pArtGrpDepositRefundIn (default: 501)
- Deposit refund sold: Sales per item group set in hidden parameter: pArtGrpDepositRefundSold (default: 500)
- Deposit refund balance: sum of 3 values above
|
| Expand |
|---|
| 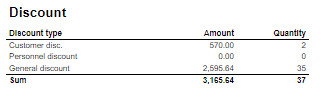
Coulmns: - Amount: Discount amount
- Quantity: Number of receipts with discount
Rows: - Customer disc.: discount with discount key: CustomerGroup
- Personnel discount: discount for employees with discount key: Subtotal
- General discount: discount with key: Line
|
| Expand |
|---|
| 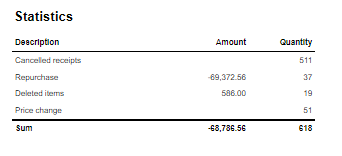
Parameters: - pDeletedReceiptStatuses - To set which statuses should be included in Cancelled receipts. Default value = {[Status].[Status Key].[DeletedReceipt],[Status].[Status Key].[DeletedUnfinishedReceipt],[Status].[Status Key].[DeletedFromUnfinishedReceipt]}
- Example to include receipts which are deleted from onlhold set value to: {[Status].[Status Key].[DeletedReceipt],[Status].[Status Key].[DeletedUnfinishedReceipt],[Status].[Status Key].[DeletedFromUnfinishedReceipt],[Status].[Status Key].[DeletedFromOnHold]}
- NB! Use only valid statuses from Reporting DW.DimStatus (StatusKey)
Columns: - Amount: Sales amount inc. VAT (valid only for Repurchase and Price change)
- Qunatity: Number of receipts for Cancelled receipts and Repurchase; number of items for Deleted items and Price change
Rows: - Cancelled receipts: Number of deleted/cancelled receipts
- Repurchase: All returns except those for item groups set in hidden parameters: pArtGrpManualDepositRefundIn (default 502) and pArtGrpDepositRefundIn (default 501)
- Deleted items: Items from Cancelled receipts
- Price change: Number of items sold with changed price
|
Source: - Lindbak POS Reporting cube (OLAP)
|
...
| Expand |
|---|
| title | 0542_ItemTransactionReasonCodes |
|---|
|
RTC-27768 
Description: Report lists all reasoncodes for all stores. Layout of the report makes it easy to export data to Excel. Selections: - Date from - Default today
- Date to - Default today
- Store - Default All (if HQ user)
- Transaction type - Default All types. It is possible to removed transaction types from list with hidden parameter pTransactionTypesToExclude, see relevant parameters for details
- Reason code - Default all available codes. List shows only reasoncodes linked to selected transaction types. NB! Depending on Chain Web version. When you select transaction type, only first available reason code will be selected. Workaround for this is to de-select all reason codes before seleting transaction type(s).
- Absolute values - Default off. This will show all values as positive values. Used to get correct quantity when you have transactions with positive and negative values. Note that this will not affect sum of same item / reasoncode. Default selection can be changed in parameter pShowAbsoluteValues
Relevant parameters: - pTransactionTypesToExclude - Comma separated list of transactions types not to show in list of transaction types. E.g. If customer never uses transaction type Aricle Service and Inventory, put in Normal,ArticleSerivce,Inventory in string (Normal shoul always be excluded)
- pShowAbsoluteValues - To change default value for 'Absolute values' selection
- pGrouping - To change default value for 'Grouping' selection
Output: List of item transactions with reason codes Columns (interactive sorting on Storenum, Storename, Transaction type and Reason code): - Store num - Store number
- Store name - Store name
- Transaction type - Transaction type
- Reason code - Reason code (default sorted on this column)
- Net cost - Total net cost (cost price) for row
- Quantity - Total quantity for row
- Net amount - Total amount without VAT for row
- Amount w / VAT - Total amount with VAT for row
- GP% - Gross profit in percentage
Clarifications: - Action code is not supported, only reason code (action code not available in Olap (reporting v77))
- Report shows only item transactions from poslog (no Rigal)
- Showing absolute values for same item / reasoncode is not possible (reporting v77). Report will always show sum of same item / reasoncode even if there are positive and negative values.
- Exampe:
 - Without absolute values Report will show Quantity = -3 which is correct
- With absolute values report will show Quantity = 3, ideally it should split this into two lines
|
| Anchor |
|---|
| 06000543_SalesPerArticleGroupAndVAT_CSVItemTransactions0600 |
|---|
| 0543_SalesPerArticleGroupAndVAT_CSVItemTransactions |
|---|
|
| Expand |
|---|
| title | 06000543_SalesPerArticleGroupAndVAT_CSVItemTransactions |
|---|
|
 Image Removed Image Removed Image Added Image Added
Description: Report lists sales per itemgroup. Selections: - EOD date from - Default select date from
- EOD date to - Default select date to
Output: Report shows sales statistics for itemgroup in selected period of time and for selected store. Columns: - Item group
- Gr. name – Group name
- Quantity
- VAT class
- VAT %
- Ex. VAT – Excluding VAT
- VAT
- Sales w/VAT
Source: - Lindbak POS Reporting DW
- Lindbak POS Message Service
|
...
| title | 0601_SalesPerArticleGroupAndVAT |
|---|
 Image Removed
Description:
Report shows sales aggregated by article group and VAT.
Selections:
- Store - Default select a single store
- Year - Default current year
- EOD Date from - Default selected date automatically
- EOD Date to - Default selected date atomatically
- Include nonsale - Default true
Output:
Report shows sales per itemgroup. Report shows three tables: fuel, bulk products and item sales. Report has summary for each table and total summary for all stores.
Columns:
- Item group
- Gr. name – Group name
- Quantity
- VAT class
- VAT % - VAT percentage
- Ex. VAT – Excluding VAT
- VAT
- Sales w/VAT – Sales with VAT
Source:
RTP-33121 General report for item transaction. This report will show all item transactions with reason code. Report is similar to 0541 without item number and two extra columns for net cost. Source: - Lindbak POS Reporting cube ((OLAP) Item Transaction RealTime measure)
Selections: - Date from - Default today
- Date to - Default today
- Store - Default All (if HQ user)
- Transaction type - Default All types. It is possible to removed transaction types from list with hidden parameter pTransactionTypesToExclude, see relevant parameters for details
- Reason code - Default all available codes. List shows only reasoncodes linked to selected transaction types. NB! Depending on Chain Web version. When you select transaction type, only first available reason code will be selected. Workaround for this is to de-select all reason codes before seleting transaction type(s).
- Absolute values - Default off. This will show all values as positive values. Used to get correct quantity when you have transactions with positive and negative values. Note that this will not affect sum of same item / reasoncode. Default selection can be changed in parameter pShowAbsoluteValues
- Grouping - Default Group. This will decide on which level of hierarchy report is generated. Report always shows item, it will also show total for group, area, department and store depending on selection. Default selection can be changed in parameter pGrouping
- Department - To filter result on department
- Article area - To filter result on article area
- Article group - To filter result on article group
Relevant parameters: - pTransactionTypesToExclude - Comma separated list of transactions types not to show in list of transaction types. E.g. If customer never uses transaction type Aricle Service and Inventory, put in Normal,ArticleSerivce,Inventory in string (Normal shoul always be excluded)
- pShowAbsoluteValues - To change default value for 'Absolute values' selection
- pGrouping - To change default value for 'Grouping' selection
Output: List of item transactions with reason code Columns (sum for store and each level of hierarchy. Sum total on last row): - EAN - EAN of item
- Item name - Item name
- Transaction type - Transaction type
- Reason code - Reason code
- Date - Date of transaction
- Unit net code - Net cost per item
- Net price - Net price per unit
- Price w/VAT - Price including VAT per unit
- Quantity - quantity
- Net cost amount - Net cost for transaction
- Net amount - Net amount (Net price * Quantity)
- Amount w/VAT - Amount including VAT (Price w/VAT * Quantity)
- GP% - Gross profit in percentage
Clarifications: - Action code is not supported, only reason code (action code not available in Olap (reporting v77))
- Report shows only item transactions from poslog (no Rigal)
- Showing absolute values for same item / reasoncode is not possible (reporting v77). Report will always show sum of same item / reasoncode even if there are positive and negative values.
- Exampe:
- Image Added
- Without absolute values Report will show Quantity = -3 which is correct
- With absolute values report will show Quantity = 3, ideally it should split this into two lines
|
| Anchor |
|---|
| 0600_SalesPerArticleGroupAndVAT_CSV |
|---|
| 0600_SalesPerArticleGroupAndVAT_CSV |
|---|
|
| Expand |
|---|
| title | 0600_SalesPerArticleGroupAndVAT_CSV |
|---|
|
Image Added Description: Report lists sales per itemgroup. Selections: - EOD date from - Default select date from
- EOD date to - Default select date to
Output: Report shows sales statistics for itemgroup in selected period of time and for selected store. Columns: - Item group
- Gr. name – Group name
- Quantity
- VAT class
- VAT %
- Ex. VAT – Excluding VAT
- VAT
- Sales w/VAT
|
...
| title | 0602_ArticleGroupSales |
|---|
 Image Removed
Description:
Report lists item group sales with drilldown for selected stores
Selections:
- Periode – default month
- Year – Default current year
- Month – Default current month
- Week – Default current week
- Date from – Default today
- Date to – Default today
- Maingroup – Default all
- Profile – Default all
- Team – Default all
- Store – Default all
Output:
- One page per store. Report has a summary on each column.
- Summary totals in the beginning of new hierarchy level for store.
Columns:
- Item group
- Sales – sales net amount
- Sales last year – Sales net amount last year
- Diff. – Difference for sales, total sales, customers, average sales and gross profit
- Diff. % - Difference percentage
- Total sales YTD – Total sales year to date
- Total sales YTD LY – Total sales year ro date last year
- Cust # - Number of customers
- Customers LY – Customers last year
- Average sale
- Average sale last year
- GP % - Gross profit percentage
- Gr. prof. % LY – Gross profit percentage last year
- GP – Gross profit
- GP LY – Gross profit last year
Clarifications:
Negative values are colored red.
Source:
- Lindbak POS Reporting DW
- Lindbak POS Reporting Cube (OLAP)
...
| Expand |
|---|
|
 Image Removed Image Removed
Description: Report lists sales per hour with counting customer inside and outside. Selections: - Periode – default month
- Year – Default current year
- Month – Default current month
- Week – Default current week
- Date from – Default today
- Date to – Default today
- Profile – Default all
- Team – Default all
- Store – Default all
- Exclude groups – Default false
- Excluded groups – Default list of excluded groups
Output: - Report has a summary at the end of table on each column.
- Summary totals in the beginning of new hierarchy level for store.
Columns: - Hour – Hour of a day
- Sales – Sales amount
- Net cost
- VAT – VAT amount
- Gr. prof. % - Gross profit percentage
- Share
- Items – Sales quantity
- Quantity - Customer inside/Customer outside quantity
- Sale per customer - Customer inside/Customer outside sale per customer
- Sales/item – Sales amount divided by item quantity Items per customer
- Sales – Member/Campaign sales amount
- Items – Member/Campaign item quantity
- Customers – Member/Campaign customer count
Source: - Lindbak POS Reporting DW
- Lindbak POS Reporting Cube (OLAP)Message Service
|
| Anchor |
|---|
| 06040601_SalesAndWastePerArticleSalesPerArticleGroupAndVAT0604 |
|---|
| 0601_SalesAndWastePerArticleSalesPerArticleGroupAndVAT |
|---|
|
| Expand |
|---|
| title | 06040601_SalesAndWastePerArticleSalesPerArticleGroupAndVAT |
|---|
|
 Image RemovedImage Added Image RemovedImage Added
Description: Report lists shows sales and waste per articleaggregated by article group and VAT. Selections: - Periode – Default monthStore - Default select a single store
- Year – - Default current yearMonth
- EOD Date from – Default current month
- Month to – Default current month
- Week from – Default current week
- Week to – Default current week
- Date from – Default today
- Date to – Default today
- Maingroup – Default all
- Year comparable – Default previous year
- Month from comparable – Default current month
- Week from comparable – Default current week
- Date from comparable – Default today
- Profile – Default all
- Team – Default all
- Store – Default select a multi value
Output: - Totals in the beginning of new hierarchy level for:
- Store
- Month
- Article group
- Article subgroup
- Article name
Columns: - Buttons for expanding and collapsing all drilldowns
- Item
- Period 1/Period 2
- Net amount
- Quantity
- Waste amount ex. VAT – Waste amount excluding VAT
- Waste qty – Waste quantity
- Gross profit after waste
- Gross % after – Gross profit percentage after waste
Source: Lindbak POS Reporting Cube (OLAP)- - Default selected date automatically
- EOD Date to - Default selected date atomatically
- Include nonsale - Default true
Output: Report shows sales per itemgroup. Report shows three tables: fuel, bulk products and item sales. Report has summary for each table and total summary for all stores. Columns: - Item group
- Gr. name – Group name
- Quantity
- VAT class
- VAT % - VAT percentage
- Ex. VAT – Excluding VAT
- VAT
- Sales w/VAT – Sales with VAT
Source:
|
| Anchor |
|---|
| 06050602_SalesAndWastePerArticleFromRIGALArticleGroupSales0605 |
|---|
| 0602_SalesAndWastePerArticleFromRIGALArticleGroupSales |
|---|
|
| Expand |
|---|
| title | 06050602_SalesAndWastePerArticleFromRIGALArticleGroupSales |
|---|
|
 Image RemovedImage Added Image RemovedImage Added
Description: Report lists sales and waste per articleitem group sales with drilldown for selected stores Selections: - Periode – Default default month
- Year – Default current year
- Month from – Default current month
- Month to – Default current month
- Week from – Default current weekWeek to – Default current week
- Date from – Default today
- Date to – Default today
- Maingroup – Default all
- Year comparable – Default previous year
- Month from comparable – Default current month
- Week from comparable – Default current week
- Date from comparable – Default today
- Profile – Default all
- Team – Default all
- Store – Default select a multi valueall
Output: - One page per store. Report has a summary on each column.
- Summary totals Report is based on report 0604 from RIGAL files. Totals in the beginning of of new hierarchy level for :
- Store
- Month
- Article group
- Article subgroup
- Article name
Columns: Buttons for expanding and collapsing all drilldownsItemColumns: - Item group
- Sales – sales net amount
- Sales last year – Sales net amount last year
- Diff. – Difference for sales, total sales, customers, average sales and gross profit
- Diff. % - Difference percentage
- Total sales YTD – Total sales year to date
- Total sales YTD LY – Total sales year ro date last year
- Cust # - Number of customers
- Customers LY – Customers last year
- Average sale
- Average sale last year
- GP % - Gross profit percentage
- Gr. prof. % LY – Gross profit percentage last year
- GP – Gross profit
- GP LY – Gross profit last year
Clarifications: Negative values are colored red. Period 1/Period 2Net amountQuantityWaste amount ex. VAT – Waste amount excluding VATWaste qty – Waste quantityGross profit after wasteGross % after – Gross profit percentage after wasteSource: - Lindbak POS Reporting DW
- Lindbak POS Reporting Cube (OLAP)
- Lindbak POS Reporting DW
|
| Anchor |
|---|
| 06060603_DifferentialReportSalesPerHour0606 |
|---|
| 0603_DifferentialReportSalesPerHour |
|---|
|
| Expand |
|---|
| title | 06060603_DifferentialReportSalesPerHour |
|---|
|
 Image RemovedImage Added Image RemovedImage Added
Description: Report lists sales statistics about items in selected store and comparable store and their differenceper hour with counting customer inside and outside. Selections: - Period Periode – Default default month
- Year – Default current yearMonth from – Default current month
- Month to – Default current monthWeek from – Default current week
- Week to – Default current week
- Date from – Default today
- Date to – Default today
- Store Profile – Default select a single valueall
- Team Year comparable – Default last yearall
- Store Month from comparable – Default current monthMonth to comparable all
- Exclude groups – Default courrent month
- Week from comparable – Default last week
- Week to comparable – Default last week
- Date from comparable – Default same day last year ago
- Date to comparable – Default same day last year ago
- Store comparable – Default select a single value
- Vendor – Default all
- Producer – Default all Department – Default all
- Area – Default all Article group – Default all
- EANlist – Default empty
Output: - Report has a total summary on the end of table for each column.
- Totals in the beginning of new hierarchy level for:
- Department
- Item area
- Item group
Columns: - false
- Excluded groups – Default list of excluded groups
Output: - Report has a summary at the end of table on each column.
- Summary totals in the beginning of new hierarchy level for store.
Columns: - Hour – Hour of a day
- Sales – Sales amount
- Net cost
- VAT – VAT amount
- Gr. prof. % - Gross profit percentage
- Share
- Items – Sales quantity
- Quantity - Customer inside/Customer outside quantity
- Sale per customer - Customer inside/Customer outside sale per customer
- Sales/item – Sales amount divided by item quantity Items per customer
- Sales – Member/Campaign sales amount
- Items – Member/Campaign item quantity
- Customers – Member/Campaign customer count
- Buttons for expanding and collapsing all drilldowns
- EAN
- Item name
- Store/Comparable store in selected period of time
- Net amount
- Quantity
- Gross profit
- GP % - Gross profit percentage
- Difference
- Net amount
- Diff % - Difference percentage
- Quantity
- Gross profit
GP % - Gross profit percentage
Source: - Lindbak POS Reporting DW
- Lindbak POS Reporting Cube (OLAP)
|
| Anchor |
|---|
| 06070604_SalesPerItemInGroupSalesAndWastePerArticle0607 |
|---|
| 0604_SalesPerItemInGroupSalesAndWastePerArticle |
|---|
|
| Expand |
|---|
| title | 06070604_SalesPerItemInGroupSalesAndWastePerArticle |
|---|
|
 Image RemovedImage Added Image RemovedImage Added
Description: Report lists sales and waste per item.article Selections: - Store Periode – Default select a single storemonth
- Year – Default current year
- EOD Date Month from – Default empty, automatically selected date
- EOD Date to - Default empty, automatically selected date
- Include nonsale – Defualt true
- Article group – Default all
Output: Report shows sales per item with summary for item groups and total summary for all item groups. Columns: - current month
- Month to – Default current month
- Week from – Default current week
- Week to – Default current week
- Date from – Default today
- Date to – Default today
- Maingroup – Default all
- Year comparable – Default previous year
- Month from comparable – Default current month
- Week from comparable – Default current week
- Date from comparable – Default today
- Profile – Default all
- Team – Default all
- Store – Default select a multi value
Output: - Totals in the beginning of new hierarchy level for:
- Store
- Month
- Article group
- Article subgroup
- Article name
Columns: - Buttons for expanding and collapsing all drilldowns
- Item
- Period 1/Period 2
- Net amount
- Quantity
- Waste amount ex. VAT – Waste amount excluding VAT
- Waste qty – Waste quantity
- Gross profit after waste
- Gross % after – Gross profit percentage after waste
- EAN Item – Article name
- Quantity
- VAT class
- VAT % - VAT percentage
- Ex. VAT – Excluding VAT
- VAT
- Sales w/VAT – Sales with VAT
Source: - Lindbak POS Reporting Cube (OLAP)
- Lindbak POS Reporting DW
|
| Anchor |
|---|
| 06080605_SalesPerDepartmentSalesAndWastePerArticleFromRIGAL0608 |
|---|
| 0605_SalesPerDepartmentSalesAndWastePerArticleFromRIGAL |
|---|
|
| Expand |
|---|
| title | 06080605_SalesPerDepartmentSalesAndWastePerArticleFromRIGAL |
|---|
|
 Image RemovedImage Added Image RemovedImage Added
Description: Report lists sales and waste per departmentarticle Selections: - Store Periode – Default select a single storemonth
- Year – Default current year
- Month from – Default current month
- Month to – Default current month
- Week from – Default current week
- Week to – Default current week
- EOD Date from – Default empty, automatically selected datetodayEOD
- Date to - Default empty, automatically selected date
- Include nonsale – Defualt true
Output: Report shows four tables: fuel, retail goods, automatic car wsa and groups. Each table has a summary and report has total summarize for all tables. Columns: - – Default today
- Maingroup – Default all
- Year comparable – Default previous year
- Month from comparable – Default current month
- Week from comparable – Default current week
- Date from comparable – Default today
- Profile – Default all
- Team – Default all
- Store – Default select a multi value
Output: - Report is based on report 0604 from RIGAL files. Totals in the beginning of new hierarchy level for:
- Store
- Month
- Article group
- Article subgroup
- Article name
Columns: - Buttons for expanding and collapsing all drilldowns
- Item
- Period 1/Period 2
- Net amount
- Quantity
- Waste amount ex. VAT – Waste amount excluding VAT
- Waste qty – Waste quantity
- Gross profit after waste
- Gross % after – Gross profit percentage after waste
- Department – Department key
- Dept name – Department name
- Area no – Area number
- Area name
- Quantity
- VAT class
- VAT % - VAT percentage
- Ex. VAT – Sales amount without excluding VAT
- VAT
- Sales w/VAT – Sales with VAT
Source: - Lindbak POS Reporting Cube (OLAP)
- Lindbak POS Reporting DW
|
| Anchor |
|---|
| 06090606_SalesPerArticleGroupWithBreakageDifferentialReport0609 |
|---|
| 0606_SalesPerArticleGroupWithBreakageDifferentialReport |
|---|
|
| Expand |
|---|
| title | 06090606_SalesPerArticleGroupWithBreakageDifferentialReport |
|---|
|
Image Added RTC-14247  Image Removed Image Removed
Description: Report lists sales per article group with breakagestatistics about items in selected store and comparable store and their difference. Selections: - EOD date from - Default select a single date
- EOD date to – Default select a single date
Output: Report shows sales per article group with breakage Columns: - Article Group – Article group key
- Article Group name
- Quantity
- VAT Class
- VAT % - VAT perentage
- Ex. VAT – Excluding VAT
- VAT
- Sales w/VAT – Sales without VAT
- Butikknr – Store number
- Dato – CSV Date
- Net cost
- Breakage
- Breakage Net
Source: - Lindbak POS Reporting DW
- Lindbak POS Message Service
|
...
- Period – Default month
- Year – Default current year
- Month from – Default current month
- Month to – Default current month
- Week from – Default current week
- Week to – Default current week
- Date from – Default today
- Date to – Default today
- Store – Default select a single value
- Year comparable – Default last year
- Month from comparable – Default current month
- Month to comparable – Default courrent month
- Week from comparable – Default last week
- Week to comparable – Default last week
- Date from comparable – Default same day last year ago
- Date to comparable – Default same day last year ago
- Store comparable – Default select a single value
- Vendor – Default all
- Producer – Default all Department – Default all
- Area – Default all Article group – Default all
- EANlist – Default empty
Output: - Report has a total summary on the end of table for each column.
- Totals in the beginning of new hierarchy level for:
- Department
- Item area
- Item group
Columns: - Buttons for expanding and collapsing all drilldowns
- EAN
- Item name
- Store/Comparable store in selected period of time
- Net amount
- Quantity
- Gross profit
- GP % - Gross profit percentage
- Difference
- Net amount
- Diff % - Difference percentage
- Quantity
- Gross profit
- GP % - Gross profit percentage
Source: Lindbak POS Reporting Cube (OLAP)
|
| Anchor |
|---|
| 0607_SalesPerItemInGroup |
|---|
| 0607_SalesPerItemInGroup |
|---|
|
| Expand |
|---|
| title | 0607_SalesPerItemInGroup |
|---|
|
Image Added |
...
| Expand |
|---|
| title | 0610_SalesPerArticleSubgroupAndVAT_CSV |
|---|
|
CO-198145, RTC-19436  Image Removed Image Removed
Description: Report lists sales per article subgroup and VAT with export to CSVitem. Selections: - EOD date from - Store – Default select a single store
- Year – Default current year
- EOD Date from – Default empty, automatically selected date
- EOD date Date to - Default select a single dateempty, automatically selected date
- Include nonsale – Defualt true
- Article group – Default all
Output: Report shows sales per item subgroupwith summary for item groups and total summary for all item groups. Columns: - Grp. no. - Article group number
- Gr. name - Article group name
- Sgr. no - Subgroup number
- Subgr. name - Subgroup EAN Item – Article name
- Quantity
- VAT class
- VAT % - VAT percentage
- Ex. VAT - Sales excluding – Excluding VAT
- VAT
- Sales w/VAT - – Sales with VATCost price
Source: - Lindbak POS Reproting Reporting DWLindbak POS Message Service
|
| Anchor |
|---|
| 06110608_SalesPerArticleSubgroupAndVATSalesPerDepartment0611 |
|---|
| 0608_SalesPerArticleSubgroupAndVATSalesPerDepartment |
|---|
|
| Expand |
|---|
| title | 06110608_SalesPerArticleSubgroupAndVATSalesPerDepartment |
|---|
|
Image Added CO-217863, RTC-25043  Image Removed Image Removed
Description: Report lists sales per article subgroup and VATdepartment Selections: - Store – Default select a single store
- Run for latest EOBD period Year – Default falsecurrent year
- EOD date Date from – Default select a single empty, automatically selected date
- EOD date Date to – Default select a single date- Default empty, automatically selected date
- Include nonsale – Defualt true
Output: Report shows sales per item subgroup. Report four tables: fuel, retail goods, automatic car wsa and groups. Each table has a summary for each item group and report has total summary for whole tablesummarize for all tables. Columns: - Department – Department key
- Dept name – Department name
- Area no – Area number
- Area
- Sgr. No – Subgroup number
- Subgr. name – Subgroup name
- Quantity
- VAT class
- VAT % - VAT percentage
- Ex. VAT – Amount Sales amount without excluding VAT
- VAT
- Sales w/VAT – Sales with VATCost price
Source: - Lindbak POS Reporting DWLindbak POS Message Service
|
| Anchor |
|---|
| 06120609_StoreSettlementPerWorkstationSalesPerArticleGroupWithBreakage0612 |
|---|
| 0609_StoreSettlementPerWorkstationSalesPerArticleGroupWithBreakage |
|---|
|
| Expand |
|---|
| title | 06120609_StoreSettlementPerWorkstationSalesPerArticleGroupWithBreakage |
|---|
|
CO-256310, RTC-3035114247  Image RemovedImage Added Image RemovedImage Added
Description: Report allows to follow up store settlement: on first page settlement for all selected workstations and settlement per each workstation on following pages. Report is divided in 16 subreports which will be descriped separatly below.lists sales per article group with breakage. Selections: - EOD date from - Default select a single date
- EOD date to – Default select a single date
Output: Report shows sales per article group with breakage Columns: - Article Group – Article group key
- Article Group name
- Quantity
- VAT Class
- VAT % - VAT perentage
- Ex. VAT – Excluding VAT
- VAT
- Sales w/VAT – Sales without VAT
- Butikknr – Store number
- Dato – CSV Date
- Net cost
- Breakage
- Breakage Net
Source: - Lindbak POS Reporting DW
- Lindbak POS Message Service
|
| Anchor |
|---|
| 0610_SalesPerArticleSubgroupAndVAT_CSV |
|---|
| 0610_SalesPerArticleSubgroupAndVAT_CSV |
|---|
|
| Expand |
|---|
| title | 0610_SalesPerArticleSubgroupAndVAT_CSV |
|---|
|
CO-198145, RTC-19436 Image Added Description: Report lists sales per article subgroup and VAT with export to CSV Selections: - EOD date from - Default select a single date
- EOD date to - Default select a single date
Output: Report shows sales per item subgroup Columns: - Grp. no. - Article group number
- Gr. name - Article group name
- Sgr. no - Subgroup number
- Subgr. name - Subgroup name
- Quantity
- VAT class
- VAT % - VAT percentage
- Ex. VAT - Sales excluding VAT
- VAT
- Sales w/VAT - Sales with VAT
- Cost price
Source: - Lindbak POS Reproting DW
- Lindbak POS Message Service
|
| Anchor |
|---|
| 0611_SalesPerArticleSubgroupAndVAT |
|---|
| 0611_SalesPerArticleSubgroupAndVAT |
|---|
|
| Expand |
|---|
| title | 0611_SalesPerArticleSubgroupAndVAT |
|---|
|
CO-217863, RTC-25043 Image Added Description: Report lists sales per article subgroup and VAT Selections: - Store – Default select a single store
- Run for latest EOBD period – Default false
- EOD date from – Default select a single date
- EOD date to – Default select a single date
Output: Report shows sales per item subgroup. Report has a summary for each item group and total summary for whole table Columns: - Sgr. No – Subgroup number
- Subgr. name – Subgroup name
- Quantity
- VAT class
- VAT % - VAT percentage
- Ex. VAT – Amount excluding VAT
- VAT
- Sales w/VAT – Sales with VAT
- Cost price
Source: - Lindbak POS Reporting DW
- Lindbak POS Message Service
|
| Anchor |
|---|
| 0612_StoreSettlementPerWorkstation |
|---|
| 0612_StoreSettlementPerWorkstation |
|---|
|
| Expand |
|---|
| title | 0612_StoreSettlementPerWorkstation |
|---|
|
CO-256310, RTC-30351 Image Added Description: Report allows to follow up store settlement: on first page settlement for all selected workstations and settlement per each workstation on following pages. Report is divided in 16 subreports which will be descriped separatly below. Selections (applies to all subreports): - Date from - Default today
- Date to - Default todauy
- Store - Default all
- Workstation - Default all
Parameters: - pExcludeDonationArticleGroups - Comma separated list of article groups to exclude from donations sectiton
- pIncludeArticleStockToRefund - Comma separated list of article groups to include in depositrefund section (deposit refund sold).
Clarifications: Report is mostly based on 0016_StoreSettlementPerWorkstation_std report. Additionaly report contains new 1022_subPaymentCard report, GLN code for each store in title and multivalue selections for stores. Subreports: | Expand |
|---|
| 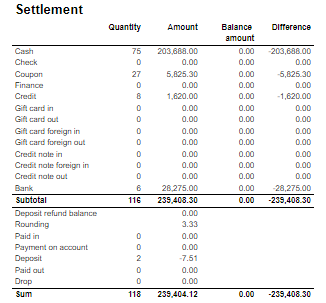 Image Added Image Added
Columns: - Quantity
- Amount
- Balance amount
- Difference: Balance amount - Amount
Rows: One row per tender type . In means received, out means given (returns etc...) - Cash: Tender type key = Cash or CashBack
- Check
- Coupon
- Finance
- Credit
- Gift card in
- Gift card out
- Gift card foreign in
- Gift card foreign out
- Credit note in
- Credit note foreign in
- Credit note out
- Bank: Tender Type Key = CreditDebit or CreditDebitOffline or ECreditDebit
- Subtotal: Total for all rows above Subtotal
_ |
Selections (applies to all subreports): - Date from - Default today
- Date to - Default todauy
- Store - Default all
- Workstation - Default all
Clarifications: Report is mostly based on 0016_StoreSettlementPerWorkstation_std report. Additionaly report contains new 1022_subPaymentCard report, GLN code for each store in title and multivalue selections for stores. Subreports: | Expand |
|---|
| Image Removed Columns: - Quantity
- Amount
- Balance amount
- Difference: Balance amount - Amount
Rows: One row per tender type . In means received, out means given (returns etc...) - Cash: Tender type key = Cash or CashBack
- Check
- Coupon
- Finance
- Credit
- Gift card in
- Gift card out
- Gift card foreign in
- Gift card foreign out
- Credit note in
- Credit note foreign in
- Credit note out
- Bank: Tender Type Key = CreditDebit or CreditDebitOffline or ECreditDebit
- Subtotal: Total for all rows above Subtotal
______________________________________________________________________________________ - Deposit refound balance: Tender type key DepositRefund received - DepositRefund given
- Rounding: Subtotal rounding
- Paid in: Tender Control Type Key: PayedIn
- Payment on account: Tender Control Type Key: PaymentOnAccount
- Deposit: Article Type Key: Deposit
- Paid out: Tender Control Type Key: PayedOut
- Drop: Tender Control Type Key: Drop
|
| Expand |
|---|
| title | 1005_subDepositRefund |
|---|
| 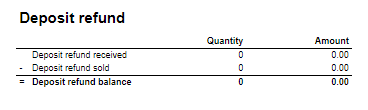 Image Removed Image Removed
Columns: - Amount: Sales amount inc. VAT
- Qunatity: Number of receipts.
Rows: - Deposit refund received: Amount (or number of receipts) for direction in for Article Type Key: DepositRefund
- Deposit refund sold: Amount (or number of receipts) for direcion out for Article Type Key: DepositRefund
- Deposit refund balance: Received - sold
|
| Expand |
|---|
| 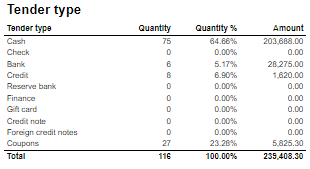 Image Removed Image Removed
Columns: - Qunatity
- Qunatity %: Share of given tender type quantity in whole quantity
- Amount: Sales inc. VAT per tender type
Rows: - One row per one tender type
|
| Expand |
|---|
| 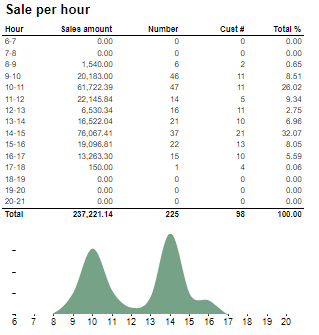 Image Removed Image Removed
Description: Sales statistics hour by hour with graph showing sales Amount. Columns: - Hour
- Sales amount: sales inc. VAT
- Number: sold quantity
- Cust #: number of receipts
- Total %: Share of sales amount per hour in whole sales amount
Rows: - one row per hour with total in the end
|
| Expand |
|---|
| title | 1008_subSettlement_2 |
|---|
| 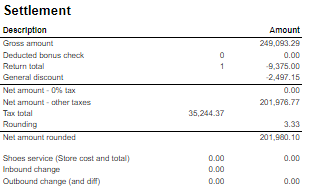 Image Removed Image Removed
Rows: - Gross amount: Amount inc. VAT + General discount - Returns
- Deducted bonus check: Return amount on article group set in hidden parameter: pBonusCheckArticleGroup
- Return total: All rerutns amount - Deducted bonus check
- General discount: Discount amount with keys: Line and Subtotal
__________________________________________________________________________________ - Net amount - 0% tax: Net amount with 0% tax
- Net amount - other taxes: Net amount
- Tax total: tax amount
- Rounding: Subtotal rounding amount
__________________________________________________________________________________ - Net amount rounded: both Net amounts + Rounding
___ - Deposit refound balance: Tender type key DepositRefund received - DepositRefund given
- Rounding: Subtotal rounding
- Paid in: Tender Control Type Key: PayedIn
- Payment on account: Tender Control Type Key: PaymentOnAccount
- Deposit: Article Type Key: Deposit
- Paid out: Tender Control Type Key: PayedOut
- Drop: Tender Control Type Key: Drop
- Shoes serviece (Store cost and total): balance amount with tender type: InboundChangeBalance; Sales inc. VAT per article with article type: Service
- Inbound change: Return amount per article with article type: Service
- Outbound change: Remaining Amoun tIn Drawer; difference: Remaining Amoun tIn Drawer - balance amount with tender type: InboundChangeBalance
|
| Expand |
|---|
| title | 10001005_subArticleSalessubDepositRefund |
|---|
| 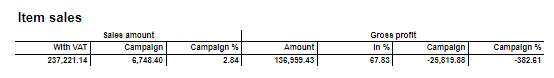 Image RemovedImage Added Image RemovedImage Added
Columns: - Sales amount With VATAmount: Sales amount Campaign: Sale amount inc. VAT for campaigns with discount keys: CampaignPrice, Group, MemberPrice
- Sales amount campaign %: Share of campain sales in all sales (Sales amount Campaign / Sales amount With VAT)
- Gross profit Amount
- Gross profit In %: Share of Gross profit in Net Amount
- Gross profit Campaign: Gross profit for Campaign
- Gross profit Campaign %: Share of gross profit for campains in campaign sales (Gross profit Campaign/ Sales amount Campaign)
Rows: - VAT
- Qunatity: Number of receipts.
Rows: - Deposit refund received: Amount (or number of receipts) for direction in for Article Type Key: DepositRefund
- Deposit refund sold: Amount (or number of receipts) for direcion out for Article Type Key: DepositRefund
- Deposit refund balance: Received - sold
|
| Expand |
|---|
| Image Added Columns: - Qunatity
- Qunatity %: Share of given tender type quantity in whole quantity
- Amount: Sales inc. VAT per tender type
| | Expand |
|---|
| title | 1012_subTaxAccounting |
|---|
| 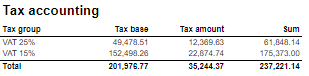 Image Removed Image Removed
Columns: - Tax group: tax type
- Tax base: Net amount
- Tax amount: tax
- Sum: Turnover inc. VAT
Rows: - One row per one tax tender type
|
| Expand |
|---|
| title | 10021009_subBanksubSalePerHour |
|---|
| 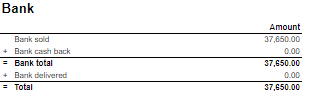 Image RemovedImage Added Image RemovedImage Added
RowsDescription: - Bank sold: Sales amount for tender types: CreditDebit, CreditDebitOffline, ECreditDebit
- Bank cash back: tender type Cash back
- Bank delivered: tender type: DeliveredBalance
|
| Expand |
|---|
| title | 1003_subBankSettlement |
|---|
| 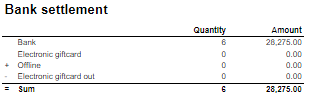 Image Removed Image Removed
Rows: - Bank: Amount for tender types: CreditDebit, CreditDebitOffline, ECreditDebit, Cash back
- Electronic giftcard: Amount for few hard coded payment card keys
- Offline: Amount for CreditDebitOffline
- Electronic giftcard out: Outcoming amount for few hard coded payment card keys
|
| Expand |
|---|
| 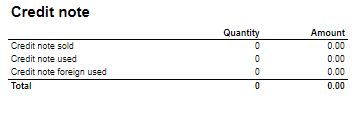 Image Removed Image Removed
Rows: - Credit note sold: Quantity/ Amount of sold by store credit notes
- Credit note used: Credit notes used in the store
- Credit note foreign used: Foreign credit notes used in the store
|
| Expand |
|---|
| 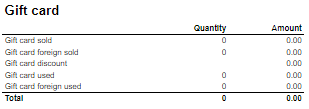 Image Removed Image Removed
Columns: - Quantity: number of gift cards
- Amount: Amount on gift cards
Rows: - Gift Card sold: Gift cards sold by given operator in given store
- Gift card foreign sold: Foreign gift cards sold by given operator in given store
- Gift card discount
- Gift card used: Sales amount inc. VAT made with gift cards. (Number of transactions made with gift cards)
- Gift card foreign used: Sales amount inc. VAT made with foreign gift cards. (Number of transactions made with foreign gift cards)
|
| Expand |
|---|
| 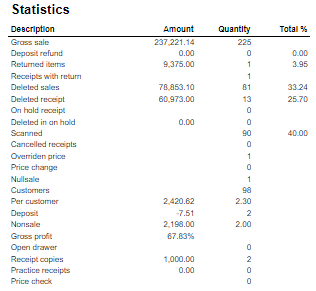 Image Removed Image Removed
Rows: - Gross sale amount: Amount inc. VAT
Total%: - Deposit refund: Deposit refound amount / Gross sale amount
- Returned items: Returned items amount/ Gross sale amount
- Deleted sales: Deleted amount/ Gross sale amount
- Deleted reciept: Deleted receipts amount/ Gross sale amount
- Scanned: Scanned quantity/ Gross sale qunatity
|
| Expand |
|---|
| 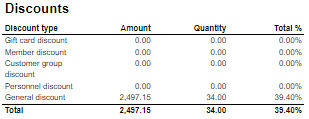 Image Removed Image Removed
Columns: - Amount: Discount amount
- Quantity: quantity of items sold with given discount
- Total %: Share of given discount amount in all discounts amount
Rows: - One row per one type of discount
|
| Expand |
|---|
| title | 1014_subReturnReasonCodes |
|---|
| 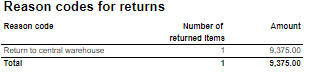 Image Removed Image Removed
Description: Amount inc. VAT and quantity of items returned. One row per reason code. |
| Expand |
|---|
| 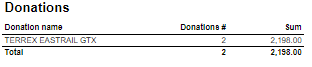 Image Removed Image Removed
Description: Nonsale Amount and number of transactions per article. Clarification: Articles to displayed can be narrowed down by changing parameter: pArticlesSet |
| Expand |
|---|
|  Image Removed Image Removed
Columns: - Paymentcard – Type of paymentcard
- Quantity – Tender count
- Amount – Tender amount
Output: - Subreport lists one row per type of payment card.
- Table has a total summary quantity and amount for all payment cards.
|
Source: - Lindbak POS Reporting Cube (OLAP)
|
...
Sales statistics hour by hour with graph showing sales Amount. Columns: - Hour
- Sales amount: sales inc. VAT
- Number: sold quantity
- Cust #: number of receipts
- Total %: Share of sales amount per hour in whole sales amount
Rows: - one row per hour with total in the end
|
| Expand |
|---|
| title | 1008_subSettlement_2 |
|---|
| Image Added Rows: - Gross amount: Amount inc. VAT + General discount - Returns
- Deducted bonus check: Return amount on article group set in hidden parameter: pBonusCheckArticleGroup
- Return total: All rerutns amount - Deducted bonus check
- General discount: Discount amount with keys: Line and Subtotal
__________________________________________________________________________________ - Net amount - 0% tax: Net amount with 0% tax
- Net amount - other taxes: Net amount
- Tax total: tax amount
- Rounding: Subtotal rounding amount
__________________________________________________________________________________ - Net amount rounded: both Net amounts + Rounding
- Shoes serviece (Store cost and total): balance amount with tender type: InboundChangeBalance; Sales inc. VAT per article with article type: Service
- Inbound change: Return amount per article with article type: Service
- Outbound change: Remaining Amoun tIn Drawer; difference: Remaining Amoun tIn Drawer - balance amount with tender type: InboundChangeBalance
|
| Expand |
|---|
| title | 1000_subArticleSales |
|---|
| Image Added Columns: - Sales amount With VAT:
- Sales amount Campaign: Sale amount inc. VAT for campaigns with discount keys: CampaignPrice, Group, MemberPrice
- Sales amount campaign %: Share of campain sales in all sales (Sales amount Campaign / Sales amount With VAT)
- Gross profit Amount
- Gross profit In %: Share of Gross profit in Net Amount
- Gross profit Campaign: Gross profit for Campaign
- Gross profit Campaign %: Share of gross profit for campains in campaign sales (Gross profit Campaign/ Sales amount Campaign)
Rows: |
| Expand |
|---|
| title | 1012_subTaxAccounting |
|---|
| Image Added Columns: - Tax group: tax type
- Tax base: Net amount
- Tax amount: tax
- Sum: Turnover inc. VAT
Rows: |
| Expand |
|---|
| Image Added Rows: - Bank sold: Sales amount for tender types: CreditDebit, CreditDebitOffline, ECreditDebit
- Bank cash back: tender type Cash back
- Bank delivered: tender type: DeliveredBalance
|
| Expand |
|---|
| title | 1003_subBankSettlement |
|---|
| Image Added Rows: - Bank: Amount for tender types: CreditDebit, CreditDebitOffline, ECreditDebit, Cash back
- Electronic giftcard: Amount for few hard coded payment card keys
- Offline: Amount for CreditDebitOffline
- Electronic giftcard out: Outcoming amount for few hard coded payment card keys
|
| Expand |
|---|
| Image Added Rows: - Credit note sold: Quantity/ Amount of sold by store credit notes
- Credit note used: Credit notes used in the store
- Credit note foreign used: Foreign credit notes used in the store
|
| Expand |
|---|
| Image Added Columns: - Quantity: number of gift cards
- Amount: Amount on gift cards
Rows: - Gift Card sold: Gift cards sold by given operator in given store
- Gift card foreign sold: Foreign gift cards sold by given operator in given store
- Gift card discount
- Gift card used: Sales amount inc. VAT made with gift cards. (Number of transactions made with gift cards)
- Gift card foreign used: Sales amount inc. VAT made with foreign gift cards. (Number of transactions made with foreign gift cards)
|
| Expand |
|---|
| Image Added Rows: - Gross sale amount: Amount inc. VAT
Total%: - Deposit refund: Deposit refound amount / Gross sale amount
- Returned items: Returned items
|
|
...
| Expand |
|---|
| title | 0613_StoreSettlementPerOperator |
|---|
|
CO-262513 RTC-31644  Image Removed Image Removed
Description: Report allows to follow up store settlement. On first page per storefor all selected cashiers (if all cashiers are selected it equals whole store settlement) and settlement per each cashier on following pages. Report is divided in subreports which will be descriped separatly below. Selections: - Date from: Default today
- Date to: Default today
- Store: Multivalue; default all
- Operator: Multivalue; default all (filtered by selected stores)
- Price channel: Multivalue; default all.
Subreports: | Expand |
|---|
| Image Removed Columns: - Quantity
- Amount
- Balance amount
- Difference: Balance amount - Amount
Rows: One row per tender type . In means received, out means given (returns etc...) - Cash: Tender type key = Cash or CashBack
- Check
- Coupon
- Finance
- Credit
- Gift card in
- Gift card out
- Gift card foreign in
- Gift card foreign out
- Credit note in
- Credit note foreign in
- Credit note out
- Bank: Tender Type Key = CreditDebit or CreditDebitOffline or ECreditDebit
- Subtotal: Total for all rows above Subtotal
______________________________________________________________________________________ - Deposit refound balance: Tender type key DepositRefund received - DepositRefund given
- Rounding: Subtotal rounding
- Paid in: Tender Control Type Key: PayedIn
- Payment on account: Tender Control Type Key: PaymentOnAccount
- Deposit: Article Type Key: Deposit
- Paid out: Tender Control Type Key: PayedOut
- Drop: Tender Control Type Key: Drop
|
| Expand |
|---|
|  Image Removed Image Removed
Rows: - Gross sale amount: Amount inc. VAT
Total%: - Deposit refund: Deposit refound amount / Gross sale amount
- Returned items: Returned items amount/ Gross sale amount
- Deleted sales: Deleted amount/ Gross sale amount
- Deleted reciept: Deleted receipts amount/ Gross sale amount
- Scanned: Scanned quantity/ Gross sale qunatity
|
| Expand |
|---|
| title | 10091006_subSalePerHoursubDiscounts |
|---|
| 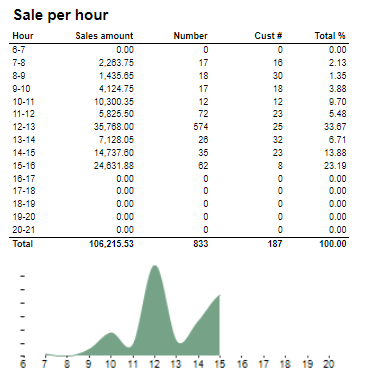 Image RemovedImage Added Image RemovedImage Added
DescriptionColumns: Sales statistics hour by hour with graph showing sales .- : Discount amount
- Quantity: quantity of items sold with given discount
Columns: - Hour
- Sales amount: sales inc. VAT
- Number: sold quantity
- Cust #: number of receipts
- Total %: Share of sales given discount amount per hour in whole sales all discounts amount
Rows: - one One row per hour with total in the endone type of discount
|
| Expand |
|---|
| title | 10131014_subTenderTypesubReturnReasonCodes |
|---|
| 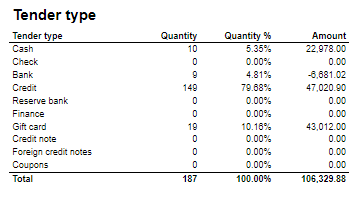 Image RemovedImage Added Image RemovedImage Added
ColumnsDescription: QunatityQunatity %: Share of given tender type quantity in whole quantityAmount : Sales inc. VAT per tender typeRows: and quantity of items returned. One row per one tender typereason code. |
| Expand |
|---|
| title | 10061015_subDiscountssubDonations |
|---|
| 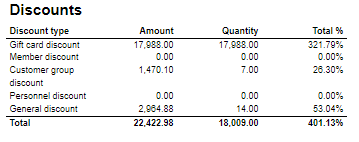 Image RemovedImage Added Image RemovedImage Added
ColumnsDescription: - Amount: Discount amount
- Quantity: quantity of items sold with given discount
- Total %: Share of given discount amount in all discounts amount
Rows: - One row per one type of discount
| | Expand |
|---|
| 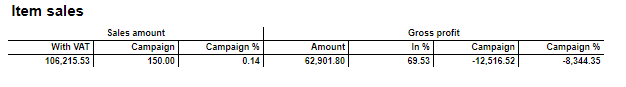 Image Removed Image Removed
Columns: - Sales amount With VAT:
- Sales amount Campaign: Sale amount inc. VAT for campaigns with discount keys: CampaignPrice, Group, MemberPrice
- Sales amount campaign %: Share of campain sales in all sales (Sales amount Campaign / Sales amount With VAT)
- Gross profit Amount
- Gross profit In %: Share of Gross profit in Net Amount
- Gross profit Campaign: Gross profit for Campaign
- Gross profit Campaign %: Share of gross profit for campains in campaign sales (Gross profit Campaign/ Sales amount Campaign)
Rows:
|
...
Nonsale Amount and number of transactions per article. Clarification: Articles to displayed can be narrowed down by changing parameter: pArticlesSet |
| Expand |
|---|
| Image Added Columns: - Paymentcard – Type of paymentcard
- Quantity – Tender count
- Amount – Tender amount
Output: - Subreport lists one row per type of payment card.
- Table has a total summary quantity and amount for all payment cards.
|
Source: - Lindbak POS Reporting Cube (OLAP)
|
| Anchor |
|---|
| 0613_StoreSettlementPerOperator |
|---|
| 0613_StoreSettlementPerOperator |
|---|
|
| Expand |
|---|
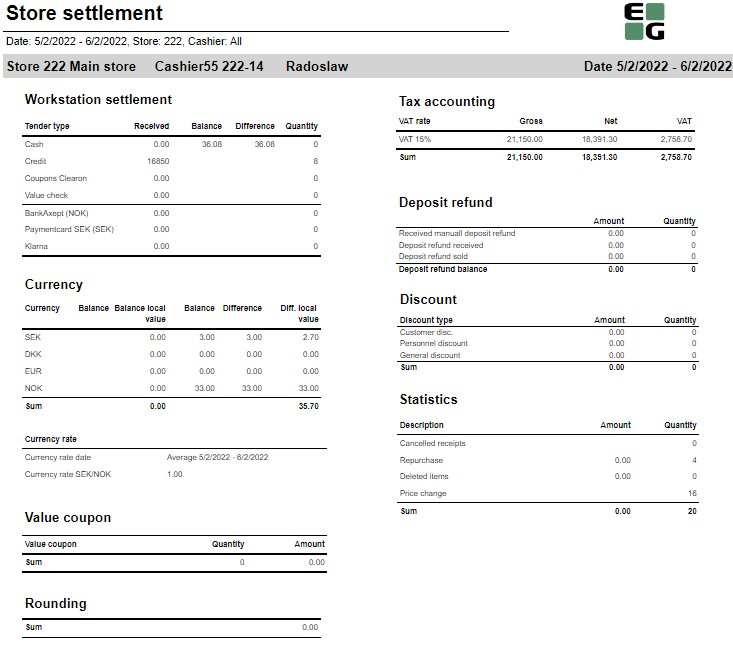
| title | 0613_StoreSettlementPerOperator |
|---|
|
...
| Expand |
|---|
| title | 0614_StoreSettlementPerWorkstation |
|---|
|
CO-262513 RTC-31644
 Image RemovedImage Added Image RemovedImage Added
Description: Report allows to follow up store settlement. On first page per store, data for storefor all selected cash registers cashiers (if all cash registers cashiers are selected it equals whole store settlement) and settlement per each cash register cashier on following pages. Report is divided in subreports which will be descriped separatly below. Selections: - Date from: Default today
- Date to: Default today
- Store: Multivalue; default all
- WorkstationOperator: Multivalue; default all (filtered by store)selected stores)
- Price channel: Multivalue; default all.
Subreports: | Expand |
|---|
|
Columns: - Quantity
- Amount
- Balance amount
- Difference: Balance amount - Amount
Rows: One row per tender type . In means received, out means given (returns etc...) - Cash: Tender type key = Cash or CashBack
- Check
- Coupon
- Finance
- Credit
- Gift card in
- Gift card out
- Gift card foreign in
- Gift card foreign out
- Credit note in
- Credit note foreign in
- Credit note out
- Bank: Tender Type Key = CreditDebit or CreditDebitOffline or ECreditDebit
- Subtotal: Total for all rows above Subtotal
______________________________________________________________________________________ - Deposit refound balance: Tender type key DepositRefund received - DepositRefund given
- Rounding: Subtotal rounding
- Paid in: Tender Control Type Key: PayedIn
- Payment on account: Tender Control Type Key: PaymentOnAccount
- Deposit: Article Type Key: Deposit
- Paid out: Tender Control Type Key: PayedOut
- Drop: Tender Control Type Key: Drop
|
| Expand |
|---|
| title | 10081011_subSettlement_2subStatistics |
|---|
| Image RemovedImage Added Rows: - Gross sale amount: Amount inc. VAT + General discount - Returns
- Deducted bonus check: Return amount on article group set in hidden parameter: pBonusCheckArticleGroup
- Return total: All rerutns amount - Deducted bonus check
- General discount: Discount amount with keys: Line and Subtotal
__________________________________________________________________________________ - Net amount - 0% tax: Net amount with 0% tax
- Net amount - other taxes: Net amount
- Tax total: tax amount
- Rounding: Subtotal rounding amount
__________________________________________________________________________________ - Net amount rounded: both Net amounts + Rounding
- Shoes serviece (Store cost and total): balance amount with tender type: InboundChangeBalance; Sales inc. VAT per article with article type: Service
- Inbound change: Return amount per article with article type: Service
- Outbound change: Remaining Amoun tIn Drawer; difference: Remaining Amoun tIn Drawer - balance amount with tender type: InboundChangeBalance
|
| Expand |
|---|
| Image Removed Rows: - Gross sale amount: Amount inc. VAT
Total%: - Deposit refund: Deposit refound amount / Gross sale amount
- Returned items: Returned items amount/ Gross sale amount
- Deleted sales: Deleted amount/ Gross sale amount
- Deleted reciept: Deleted receipts amount/ Gross sale amount
- Scanned: Scanned quantity/ Gross sale qunatity
|
Total%: - Deposit refund: Deposit refound amount / Gross sale amount
- Returned items: Returned items amount/ Gross sale amount
- Deleted sales: Deleted amount/ Gross sale amount
- Deleted reciept: Deleted receipts amount/ Gross sale amount
- Scanned: Scanned quantity/ Gross sale qunatity
|
| Expand |
|---|
| Image Added Description: Sales statistics hour by hour with graph showing sales Amount. Columns: - Hour
- Sales amount: sales inc. VAT
- Number: sold quantity
- Cust #: number of receipts
- Total %: Share of sales amount
| | Expand |
|---|
| Image Removed Description: Sales statistics hour by hour with graph showing sales Amount. Columns: - Hour
- Sales amount: sales inc. VAT
- Number: sold quantity
- Cust #: number of receipts
- Total %: Share of sales amount per hour in whole sales amount
Rows: - one row per hour with total in the end
|
| Expand |
|---|
| Image RemovedImage Added Columns: - Qunatity
- Qunatity %: Share of given tender type quantity in whole quantity
- Amount: Sales inc. VAT per tender type
Rows: - One row per one tender type
|
| Expand |
|---|
| title | 10141006_subReturnReasonCodessubDiscounts |
|---|
| Image RemovedImage Added DescriptionColumns: inc. VAT and quantity of items returned. One row per reason code.- : Discount amount
- Quantity: quantity of items sold with given discount
- Total %: Share of given discount amount in all discounts amount
Rows: - One row per one type of discount
|
| Expand |
|---|
| title | 1000_subArticleSalessubArticleSale |
|---|
| Image RemovedImage Added
Columns: - Sales amount With VAT:
- Sales amount Campaign: Sale amount inc. VAT for campaigns with discount keys: CampaignPrice, Group, MemberPrice
- Sales amount campaign %: Share of campain sales in all sales (Sales amount Campaign / Sales amount With VAT)
- Gross profit Amount
- Gross profit In %: Share of Gross profit in Net Amount
- Gross profit Campaign: Gross profit for Campaign
- Gross profit Campaign %: Share of gross profit for campains in campaign sales (Gross profit Campaign/ Sales amount Campaign)
Rows: |
|
| Anchor |
|---|
| 06150614_StoreSettlement_CSVStoreSettlementPerWorkstation0615 |
|---|
| 0614_StoreSettlement_CSVStoreSettlementPerWorkstation |
|---|
|
| Expand |
|---|
| title | 06500614_CreditInfoStoreSettlementPerWorkstation |
|---|
|
CO-262513 RTC-27343531644  Image RemovedImage Added Image RemovedImage Added
Description: Report lists data from some of sub-reports used in 0612. Output is to make it easier for exporting data to csv formatallows to follow up store settlement. On first page per store, data for all selected cash registers (if all cash registers are selected it equals whole store settlement) and settlement per each cash register on following pages. Report is divided in subreports which will be descriped separatly below. Selections: - Date from - : Default today
- Date to - : Default today
- Profile - Default all
- Store - Default all
Output: Report lists data from sub-reports listed below in one line per store section (sub-report) type and measure. Data is aggregated per store within date selection. Columns: - Store num. - Store number
- Store name - Store name
- GLN - Global location number
- Section - Section (sub-report) is Tender type, Tax accounting, Deposit Refund
|
...
CO-1904
 Image Removed
Description:
Report lists credit sales for all stores in selected period time.
Selections:
- Date from – Default today
- Date to – Default today
- Show all credit sales – Default true
Output:
Report lists every sale in period time with name of customer, references and amount. Report sum up Amount and Tax amount.
Columns:
- Date – Sales date
- Dept. – Store number
- Receipt – Transaction id
- Customer – Customer name
- Ref. no – reference number
- Ref. text – reference text
- Amount
- Tax amount – VAT amount
Source:
...
| title | 0700_SalesPerDepartment |
|---|
 Image Removed
Description:
Report lists sales in department per store.
Selections:
- Date from – Default today
- Date to – Default today
- Store – Default all
- Department – Default all
Output:
Each department has own column. Report has a summary for each column except Total share. One store per row.
Columns:
- Store -Store number and store name
- Net amount
- Gr. prof % - Gross profit percentage
- Share – Share of net amount percentage
Clarifications:
Each new added department to report create new column in report table. Report table can be too large and may be divided into several pages.
Source:
- Lindbak POS Reporting Cube (OLAP)
...
| title | 0701_TurnoverperHourWithPriceChannel |
|---|
- Store: Multivalue; default all
- Workstation: Multivalue; default all (filtered by store)
Subreports:
| Expand |
|---|
| Image Added Columns: - Quantity
- Amount
- Balance amount
- Difference: Balance amount - Amount
Rows: One row per tender type . In means received, out means given (returns etc...) - Cash: Tender type key = Cash or CashBack
- Check
- Coupon
- Finance
- Credit
- Gift card in
- Gift card out
- Gift card foreign in
- Gift card foreign out
- Credit note in
- Credit note foreign in
- Credit note out
- Bank: Tender Type Key = CreditDebit or CreditDebitOffline or ECreditDebit
- Subtotal: Total for all rows above Subtotal
______________________________________________________________________________________ - Deposit refound balance: Tender type key DepositRefund received - DepositRefund given
- Rounding: Subtotal rounding
- Paid in: Tender Control Type Key: PayedIn
- Payment on account: Tender Control Type Key: PaymentOnAccount
- Deposit: Article Type Key: Deposit
- Paid out: Tender Control Type Key: PayedOut
- Drop: Tender Control Type Key: Drop
|
| Expand |
|---|
| title | 1008_subSettlement_2 |
|---|
| Image Added Rows: - Gross amount: Amount inc. VAT + General discount - Returns
- Deducted bonus check: Return amount on article group set in hidden parameter: pBonusCheckArticleGroup
- Return total: All rerutns amount - Deducted bonus check
- General discount: Discount amount with keys: Line and Subtotal
__________________________________________________________________________________ - Net amount - 0% tax: Net amount with 0% tax
- Net amount - other taxes: Net amount
- Tax total: tax amount
- Rounding: Subtotal rounding amount
__________________________________________________________________________________ - Net amount rounded: both Net amounts + Rounding
- Shoes serviece (Store cost and total): balance amount with tender type: InboundChangeBalance; Sales inc. VAT per article with article type: Service
- Inbound change: Return amount per article with article type: Service
- Outbound change: Remaining Amoun tIn Drawer; difference: Remaining Amoun tIn Drawer - balance amount with tender type: InboundChangeBalance
|
| Expand |
|---|
| Image Added Rows: - Gross sale amount: Amount inc. VAT
Total%: - Deposit refund: Deposit refound amount / Gross sale amount
- Returned items: Returned items amount/ Gross sale amount
- Deleted sales: Deleted amount/ Gross sale amount
- Deleted reciept: Deleted receipts amount/ Gross sale amount
- Scanned: Scanned quantity/ Gross sale qunatity
|
| Expand |
|---|
| Image Added Description: Sales statistics hour by hour with graph showing sales Amount. Columns: - Hour
- Sales amount: sales inc. VAT
- Number: sold quantity
- Cust #: number of receipts
- Total %: Share of sales amount per hour in whole sales amount
Rows: - one row per hour with total in the end
|
| Expand |
|---|
| Image Added Columns: - Qunatity
- Qunatity %: Share of given tender type quantity in whole quantity
- Amount: Sales inc. VAT per tender type
Rows: - One row per one tender type
|
| Expand |
|---|
| title | 1014_subReturnReasonCodes |
|---|
| Image Added Description: Amount inc. VAT and quantity of items returned. One row per reason code. |
| Expand |
|---|
| title | 1000_subArticleSales |
|---|
| Image Added Columns: - Sales amount With VAT:
- Sales amount Campaign: Sale amount inc. VAT for campaigns with discount keys: CampaignPrice, Group, MemberPrice
- Sales amount campaign %: Share of campain sales in all sales (Sales amount Campaign / Sales amount With VAT)
- Gross profit Amount
- Gross profit In %: Share of Gross profit in Net Amount
- Gross profit Campaign: Gross profit for Campaign
- Gross profit Campaign %: Share of gross profit for campains in campaign sales (Gross profit Campaign/ Sales amount Campaign)
Rows: |
|
| Anchor |
|---|
| 0615_StoreSettlement_CSV |
|---|
| 0615_StoreSettlement_CSV |
|---|
|
| Expand |
|---|
| title | 0615_StoreSettlement_CSV |
|---|
|
CO-273435 Image Added
Description: Report lists data from some of sections used in 0612. Output is to make it easier for exporting data to csv format. Selections: - Date from - Default today
- Date to - Default today
- Profile - Default all
- Store - Default all
Parameters: - pDepositRefundArticleGroups - List of articlegroups for deposit refund. This is used for Deposit refund sold.
Output: Report lists data from sub-reports listed below in one line per store section (sub-report) type and measure. Data is aggregated per store within date selection. Columns: - Store num. - Store number
- Store name - Store name
- GLN - Global location number
- Section - Section (sub-report) is Tender type, Tax accounting, Deposit Refund
|
| Anchor |
|---|
| 0616_StoreList |
|---|
| 0616_StoreList |
|---|
|
| Expand |
|---|
|
CO-281808 / RTC-36615  Image Added Image Added
Description: Store list provides a list of stores with key information. List of stores are grouped by profile. It is possible to exclude closed stores from the lists. NB! Report require Reporting v81 or higher. Selections: - Date - Default today
- Profile - Default all
- Include closed stores - Default off
Output: Report lists Stores with information key information. It is possible to include / exclude closed stores, this is based on Closing date and provided date in selection. Columns: - Profile - profile number
- Store num. - Store number
- Store name - Store name
- GLN - Global location number
- External store no - External store number (POS)
- Opening date - Opening date
- Closing date - Closing date
Source: Lindbak POS Reporting DW
|
| Anchor |
|---|
| 0650_CreditInfo |
|---|
| 0650_CreditInfo |
|---|
|
| Expand |
|---|
|
CO-1904 Image Added Description: Report lists credit sales for all stores in selected period time |
 Image Removed
Description:
Report shows sales per department and store
Selections:
- Date from- Default today
- Date to – Default today
- Store – Default all
- Price channels – Default all
Relevant parameters:
pHourFrom and pHoursTo are used to shows hours in column
Output:
- Report lists cash register frequence during all day with hours.
- Reports shows table for each selected store with summary on each column except column accumulated.
- There are two tables per one page.
Columns:
- Hour
- Number of workstations – Number of active workstations Amount
- Accumulated
- Share - Share of net amount percentage
- Customers
- Items
- Avg. sales customer – Average sales customer
- Price pr. Art. – Price per article
- Customers pricechannel
- Avg. sales per customer pricechannel – Average sales per customer pricechannel
- Turnover pricechannel
- Share pricechannel
Source:
- Lindbak POS Reporting Cube (OLAP)
...
 Image Removed
Description:
Report lists Coupon summary for particular store.
Selections:
- Date from – Default today
- Date to -Default today
- Store – Default select a single value
Output:
- Report shows total summary on quantity and value columns. Report shows coupon types in selected store.
- Totals in the beginning of new hierarchy level for:
Columns:
- Buttons for expanding and collapsing all drilldowns.
- Coupon type – Coupon number
- Quantity – Quantity of transactions
- Value – Sales amount
- Date – End date time
- Time – End date time
- Workstation
- Cashier name
Source:
...
 Image Removed
Description:
Report lists credit sales per customer.
Selections:
- Date from – Defualt today
- Date to – Default today
Output:
- One page per store.
- Report has a summary for store at the end of table.
- Totals in the beginning of new hierarchy level for: Date
Columns:
- Buttons for expanding and collapsing all drilldowns
- Customer num. – Customer number
- Customer
- Quantity
- Amount – Tender amount
Source:
- Lindbak POS Reporting Cube (OLAP)
...
| title | 0704_DiscountsPerOperator |
|---|
 Image Removed
Description:
Report lists discount per cashier
Selections:
- Store – Default all
- Item group – Default all
- Date from – Default today
- Date to – Default today
Output:
- Report shows summary on quantity and discount columns.
- Totals in the beginning of new hierarchy level for:
Columns:
- Buttons for expanding and collapsing all drilldowns.
- EAN
- Item name
- Reason code
- Item group
- Quantity
- Discount
- Discount % - Discount percentage
- Ord. price – Ordinary price, amount and discount divided by quantity
- Cashier – Cashier number
Source:
- Lindbak POS Reporting Cube (OLAP)
...
| Expand |
|---|
| title | 0705_TurnoverPerDayWithPriceChannel |
|---|
|
 Image Removed Image Removed
Description: Report lists cash register frequence per day. Selections: - Date from – Default today
- Date to – Default today
- Team – Default all
- Store – Default single value to select
- Workstation type – Default ordinary
- Workstation – Default all
- Price channel – Default all
- Include VAT – Default true
- Include nonsale – Default false
- Department – Default all
Output: - Show all credit sales – Default true
Output: Report lists every sale in period time with name of customer, references and amount. Report sum up Amount and Tax amountReport shows table for selected store with cash register frequence per day. Report has a summary for each column. Columns: - Date
- Turnover
- Accumulated – Acumulated amount
- Share
- Customers
- Items
- Items per customer
- Avg. sales customer – Average sales customer
- Average price per item
- Customers pricechannel
- Avg. sales per customer pricechannel – Average sales per customer pricechannel
- Turnover pricechannel
- – Sales date
- Dept. – Store number
- Receipt – Transaction id
- Customer – Customer name
- Ref. no – reference number
- Ref. text – reference text
- Amount
- Tax amount – VAT amountShare pricechannel
Source: Cube (OLAP)
|
| Anchor |
|---|
| 07060700_TurnoverPerHourWorkstationsWithPriceChannelSalesPerDepartment0706 |
|---|
| 0700_TurnoverPerHourWorkstationsWithPriceChannelSalesPerDepartment |
|---|
|
| Expand |
|---|
| title | 07060700_TurnoverPerHourWorkstationsWithPriceChannelSalesPerDepartment |
|---|
|
 Image RemovedImage Added Image RemovedImage Added
Description: Report lists cash register frequence per hour for stores in selected workstationssales in department per store. Selections: - Date from -– Default today
- Date to – Default today
- Team – Default all
- Store – Default all
- Workstation type – Default ordinary
- Workstation – Default all
- Price channels – Defaul all
- Include VAT – Default true
- Include nonsale – Default false
- Department – Default all
Output: Report shows tables for selected stores with frequence of cash registerEach department has own column. Report has a summary for each column , for each tableexcept Total share. One store per row. Columns: Hour – Hour of a dayNumber of workstationsTurnoverAccumulated – Accumulated amountShareCustomersItemsItems per customerAvg. sales customer – Average sales customerAverage price per itemCustomers pricechannelAvg. sales per customer pricechannel – Average sales per customer pricechannelTurnover pricechannel- Store -Store number and store name
- Net amount
- Gr. prof % - Gross profit percentage
- Share – Share of net amount percentage
Clarifications: Each new added department to report create new column in report table. Report table can be too large and may be divided into several pages. Share pricechannelSource: - Lindbak POS Reporting Cube (OLAP)
|
| Anchor |
|---|
| 07070701_SalesPerStoreTurnoverperHourWithPriceChannel0707 |
|---|
| 0701_SalesPerStoreTurnoverperHourWithPriceChannel |
|---|
|
| Expand |
|---|
| title | 07070701_SalesPerStoreTurnoverperHourWithPriceChannel |
|---|
|
Image Added Based on 0037 Report.  Image Removed Image Removed
Description: Report lists sales for selected store in period of time.shows sales per department and store Selections: - Date from – - Default today
- Date to – Default today
- Store – Default all
- Price channels – Default all
Relevant parameters: pHourFrom and pHoursTo are used to shows hours in column Output: sales for one row per store. Report sum up every column- cash register frequence during all day with hours.
- Reports shows table for each selected store with summary on each column except column accumulated.
- There are two tables per one page.
Columns: - Store num. -Store number
- Store name
- Total Sales - Amount
- Sale ex. VAT – Net amount
- Tax amount
- Cost – Net cost
- Quantity
- Customers – Receipt count
- ATV – Average transaction value
- UPT – Units per transaction
- Gr. prof % - Gross profit percentage
- Gross profit
Sorting: - Hour
- Number of workstations – Number of active workstations Amount
- Accumulated
- Share - Share of net amount percentage
- Customers
- Items
- Avg. sales customer – Average sales customer
- Price pr. Art. – Price per article
- Customers pricechannel
- Avg. sales per customer pricechannel – Average sales per customer pricechannel
- Turnover pricechannel
- Share pricechannel
Interactive sorting on all except Sale ex. VAT, Tax amount, Cos and Gross profitSource: - Lindbak POS Reporting Cube (OLAP)
|
| Anchor |
|---|
| 07080702_GiftcardBalanceOnGivenDateKICoupons0708 |
|---|
| 0702_GiftcardBalanceOnGivenDateKICoupons |
|---|
|
| Expand |
|---|
| title | 07080702_GiftcardBalanceOnGivenDateKICoupons |
|---|
|
 Image RemovedImage Added Image RemovedImage Added
Description: Report lists historical balance on given dateCoupon summary for particular store. Selections: - Store Date from – Default all
- Type – Default Gift card
- today
- Date to -Default today
- Store – Default select a single valueDate – Default today
Output: has a summary at the end of table.- shows total summary on quantity and value columns. Report shows coupon types in selected store.
- Totals in the beginning of new hierarchy level for:
Columns: - Buttons for expanding and collapsing all drilldowns.
- Coupon type – Coupon number
- Quantity – Quantity of transactions
- Value – Sales amount
- Date – End date time
- Time – End date time
- Workstation
- Cashier name
Columns: - Store – Store number
- Balance – Scrip balance
Source: - Lindbak RetailPOS Reporting DW
|
| Anchor |
|---|
| 07090703_SettlementCreditSales0709 |
|---|
| 0703_SettlementCreditSales |
|---|
|
| Expand |
|---|
| title | 07090703_SettlementCreditSales |
|---|
|
Image Added CO: 10400, PBI#90853  Image Removed Image Removed
Description: Report allow to follow up store settlement: all selected Chahiers (if all cashiers are selected it equals whole store settlement) and settlement per each Cashier on following pageslists credit sales per customer. Selections: Retail store – Single value; select a value from the list - Operator – Defaul all
- Date from – Default Defualt today
- Date to – Default today
Subreports Output: | Expand |
|---|
|  Image Removed Image Removed
Columns: - Tender type - payment method
- Received - Sales amount inc. VAT received in given tender type
- Balance - Money amount registered in the end of the day (sum for selected operators who made balance and selected days)
- Difference - Balance - Received
- Quantity - Number of items sold in given tender type
Output: One row per one tender type. Clarifications: - Balance and Difference make sense only for cash since only cash it's kept in cash register.
|
| Expand |
|---|
|
|
Image Removed
Columns:
- Currency
- Balance (Beholdning): Sales amount inc. VAT in main currency
- Balance local value: Sales amount inc. VAT in received currency
- Balance (Oppgjør): Money amount registered in the end of the day in given currency (sum for selected operators who made balance and selected days)
- Difference: Balance (Oppgjør) - Balance (Beholdning)
- Diff. local value: Balance (Money amount registered in the end of the day) in main currency - Balance local value
- One page per store.
- Report has a summary for store at the end of table.
- Totals in the beginning of new hierarchy level for: Date
Columns:
- Buttons for expanding and collapsing all drilldowns
- Customer num. – Customer number
- Customer
- Quantity
- Amount – Tender amount
Source:
- Lindbak POS Reporting Cube (OLAP)
| Anchor |
|---|
| 0704_DiscountsPerOperator |
|---|
| 0704_DiscountsPerOperator |
|---|
|
| Expand |
|---|
| title | 0704_DiscountsPerOperator |
|---|
|
Image Added Description: Report lists discount per cashier Selections: - Store – Default all
- Item group – Default all
- Date from – Default today
- Date to – Default today
Output: - Report shows summary on quantity and discount columns.
- Totals in the beginning of new hierarchy level for:
Columns: - Buttons for expanding and collapsing all drilldowns.
- EAN
- Item name
- Reason code
- Item group
- Quantity
- Discount
- Discount % - Discount percentage
- Ord. price – Ordinary price, amount and discount divided by quantity
- Cashier – Cashier number
Source: - Lindbak POS Reporting Cube (OLAP)
|
| Anchor |
|---|
| 0705_TurnoverPerDayWithPriceChannel |
|---|
| 0705_TurnoverPerDayWithPriceChannel |
|---|
|
| Expand |
|---|
| title | 0705_TurnoverPerDayWithPriceChannel |
|---|
|
Image Added Description: Report lists cash register frequence per day. Selections: - Date from – Default today
- Date to – Default today
- Team – Default all
- Store – Default single value to select
- Workstation type – Default ordinary
- Workstation – Default all
- Price channel – Default all
- Include VAT – Default true
- Include nonsale – Default false
- Department – Default all
Output: Report shows table for selected store with cash register frequence per day. Report has a summary for each column. Columns: - Date
- Turnover
- Accumulated – Acumulated amount
- Share
- Customers
- Items
- Items per customer
- Avg. sales customer – Average sales customer
- Average price per item
- Customers pricechannel
- Avg. sales per customer pricechannel – Average sales per customer pricechannel
- Turnover pricechannel
- Share pricechannel
| Expand |
|---|
|  Image Removed Image Removed
Columns: - Type - Non sale type
- Amount - non sale amount
Output: One row per one non sale type. |
| Expand |
|---|
|  Image Removed Image Removed
Columns: - Description - Reason codes
- Amount - Control amount
- Quantity - Control transaction quantity
Output: One row per one one reason code. Clarifications: - Tender control type relates to Paid in control type.
|
| Expand |
|---|
|  Image Removed Image Removed
Columns: - Description - Reason codes
- Amount - Control amount
- Quantity - Control transaction quantity
Output: One row per one one reason code. Clarifications: - Tender control type relates to Paid out control type.
|
| Expand |
|---|
|
|
Image Removed
Coumns:
- Gross: Sales amount inc. VAT
- Net: Sales net amount
- VAT
Output:
One row per sum one type of VAT. Vaules are summed for given store, date period and operators
| Expand |
|---|
|
 Image Removed Image Removed
Columns: - Description - Type of Reason code
- Amount
- Quantity
- Share
Output: Subreport lists one row per one reason code type. |
| Expand |
|---|
|
Image Removed
Description:
Sum of all transactions subtotal rounding (for given period, store and operators) Source:
Lindbak POS Reporting Cube (OLAP)
| Anchor |
|---|
| 07100706_SalesPerStoreTurnoverPerHourWorkstationsWithPriceChannel0710 |
|---|
| 0706_SalesPerStoreTurnoverPerHourWorkstationsWithPriceChannel |
|---|
|
| Expand |
|---|
| title | 07100706_SalesPerStoreTurnoverPerHourWorkstationsWithPriceChannel |
|---|
|
Image Added CO: 10625, PBI#116476  Image Removed Image Removed
Description: Report lists sales per store with comparison sales and differencecash register frequence per hour for stores in selected workstations. Selections: - Date from – Default first day of a current week-Default today
- Date to – Default today
- Compare date from - Default the same day of week as Date from year before
- Compare date to - Default the same day of week as Date to but year before
- Team – Default all
- Store – Default allDepartment
- Workstation type – Default allordinary
- Workstation – Default Area- Deafult allArticle group
- Price channels – Default Defaul all
- EAN list Include VAT – Default emptytrue
- Vendor Include nonsale – Default allfalse
- Subvendor Department – Default all
Output: Report lists sales in stores in selected period of time and comparison sales in other selected period of time with difference both salesshows tables for selected stores with frequence of cash register. Report has a summary of for each column, for each table. Columns: - Store – Store number and name
- Sales w/VAT – Sales amount with VAT
- Sales ex/VAT – Sales net amount excluding VAT
- Gross profit GP % - Gross profit percentage
Clarifications: Negative values are colored red.- Hour – Hour of a day
- Number of workstations
- Turnover
- Accumulated – Accumulated amount
- Share
- Customers
- Items
- Items per customer
- Avg. sales customer – Average sales customer
- Average price per item
- Customers pricechannel
- Avg. sales per customer pricechannel – Average sales per customer pricechannel
- Turnover pricechannel
- Share pricechannel
Source: - Lindbak POS Reporting Cube (OLAP)
Additional info: - The report contains two hidden parameters: pHourFrom (default: 8) and pHourTo (default: 16) that can be used to specify the range of hours in the output (default range is 8-17).
|
| Anchor |
|---|
| 07110707_SalesPerDepartmentSalesPerStore0711 |
|---|
| 0707_SalesPerDepartmentSalesPerStore |
|---|
|
| Expand |
|---|
| title | 07110707_SalesPerDepartmentSalesPerStore |
|---|
|
Based on 0037 Report. Image Added CO: 10603, PBI#116490
 Image Removed Image Removed
Description: Report lists sales per department with comparison salesfor selected store in period of time. Selections: - Date from – Default first day of a current weektoday
- Date to – Default today
- Compare date from - Default the same day of week as Date from year before
- Compare date to - Default the same day of week as Date to but year before
- Department – Default all
- Store – Default all
- Include VAT – Default true
Output: - Report shows sales per department for selected stores and period of time and comparison sales in other period of time.
- Report has a summary of each column.
- One page per store.
Columns: - No – Department number
- Name – Department name
- Sales
- Gross profit GP % - Gross profit percentage
- Diff. sales – Difference sales
- Diff. Gross profit – Difference Gross profit
- Diff. GP % - Difference Gross profit percentage
- Sales amount – Share sales amount
- GP – Share gross profit
Sorting: No – Department number (default sorting) Clarifications: Output: Report lists sales for one row per store. Report sum up every column. Columns: - Store num. -Store number
- Store name
- Total Sales - Amount
- Sale ex. VAT – Net amount
- Tax amount
- Cost – Net cost
- Quantity
- Customers – Receipt count
- ATV – Average transaction value
- UPT – Units per transaction
- Gr. prof % - Gross profit percentage
- Gross profit
Sorting: Interactive sorting on all except Sale ex. VAT, Tax amount, Cos and Gross profitNegative values are colored red. Source: - Lindbak POS Reporting Cube (OLAP)
|
| Anchor |
|---|
| 07120708_SalesPerVendorGiftcardBalanceOnGivenDate0712 |
|---|
| 0708_SalesPerVendorGiftcardBalanceOnGivenDate |
|---|
|
| Expand |
|---|
| title | 07120708_SalesPerVendorGiftcardBalanceOnGivenDate |
|---|
|
Image Added CO: 10626, PBI#116469  Image Removed Image Removed
Description: Report lists sales per vendor with comparison saleshistorical balance on given date. Selections: - Store – Default all
- Type – Default Gift card
- Date
- Date from – Default first day of a current week
- Date to – Default today
- Compare date from - Default the same day of week as Date from year before
- Compare date to - Default the same day of week as Date to but year before
- Store – Default all Department – Default all
- Area – Default all
- Article group – Default all
- EAN list – Default empty
- Vendor – Default all
Output: Report has a summary of each column. One page per store. Columns: - Vendor name – Vendor number and name
- Sales w/VAT – Sales amount with VAT
- Sales ex/VAT – Sales net amount excluding VAT
- Gross profit GP % - Gross profit percentage
Sorting: Vendor No – Vendor number (default sorting) Clarifications: Negative values are colored red. Source: - Lindbak POS Reporting Cube (OLAP)
|
...
| title | 0713_SalesPerSubvendor |
|---|
CO: 10626, PBI#116469
 Image Removed
Description:
Report lists sales per vendor with comparison sales.
Selections:
- Date from – Default first day of a current week
- Date to – Default today
- Compare date from - Default the same day of week as Date from year before
- Compare date to - Default the same day of week as Date to but year before
- Store – Default all Department – Default all
- Area – Default all
- Article group – Default all
- EAN list – Default empty
- Subvendor – Default all
Output:
Report has a summary of each column. One page per store.
Columns:
- Subvendor – Subvendor number and name
- Sales w/VAT – Sales amount with VAT
- Sales ex/VAT – Sales net amount excluding VAT
- Gross profit GP % - Gross profit percentage
Clarifications:
Negative values are colored red.
Source:
- Lindbak POS Reporting Cube (OLAP)
...
| title | 0714_SalesStatisticsWithDrill |
|---|
Output: Report has a summary at the end of table. Columns: - Store – Store number
- Balance – Scrip balance
Source:
|
| Anchor |
|---|
| 0709_Settlement |
|---|
| 0709_Settlement |
|---|
|
| Expand |
|---|
|
CO: 10400, PBI#90853 Image Added Description: Report allow to follow up store settlement: all selected Chahiers (if all cashiers are selected it equals whole store settlement) and settlement per each Cashier on following pages. Selections: - Retail store – Single value; select a value from the list
- Operator – Defaul all
- Date from – Default today
- Date to – Default today
Subreports: | Expand |
|---|
| Image Added Columns: - Tender type - payment method
- Received - Sales amount inc. VAT received in given tender type
- Balance - Money amount registered in the end of the day (sum for selected operators who made balance and selected days)
- Difference - Balance - Received
- Quantity - Number of items sold in given tender type
Output: One row per one tender type. Clarifications: - Balance and Difference make sense only for cash since only cash it's kept in cash register.
|
| Expand |
|---|
| Image Added Columns: - Currency
- Balance (Beholdning): Sales amount inc. VAT in main currency
- Balance local value: Sales amount inc. VAT in received currency
- Balance (Oppgjør): Money amount registered in the end of the day in given currency (sum for selected operators who made balance and selected days)
- Difference: Balance (Oppgjør) - Balance (Beholdning)
- Diff. local value: Balance (Money amount registered in the end of the day) in main currency - Balance local value
|
| Expand |
|---|
| Image Added Columns: - Type - Non sale type
- Amount - non sale amount
Output: One row per one non sale type. |
| Expand |
|---|
| Image Added Columns: - Description - Reason codes
- Amount - Control amount
- Quantity - Control transaction quantity
Output: One row per one one reason code. Clarifications: - Tender control type relates to Paid in control type.
|
| Expand |
|---|
| Image Added Columns: - Description - Reason codes
- Amount - Control amount
- Quantity - Control transaction quantity
Output: One row per one one reason code. Clarifications: - Tender control type relates to Paid out control type.
|
| Expand |
|---|
| Image Added Coumns: - Gross: Sales amount inc. VAT
- Net: Sales net amount
- VAT
Output: One row per sum one type of VAT. Vaules are summed for given store, date period and operators
|
| Expand |
|---|
| Image Added Columns: - Description - Type of Reason code
- Amount
- Quantity
- Share
Output: Subreport lists one row per one reason code type. |
| Expand |
|---|
| Image Added Description: Sum of all transactions subtotal rounding (for given period, store and operators) |
Source: - Lindbak POS Reporting Cube (OLAP)
|
| Anchor |
|---|
| 0710_SalesPerStore |
|---|
| 0710_SalesPerStore |
|---|
|
| Expand |
|---|
|
CO: 10625, PBI#116476 Image Added Description: Report lists sales per store with comparison sales and difference |
CO-10606, PBI#116498
 Image Removed
Description:
Report lists sales statistics with drilldowns.
Selections:
- Date from – Default today
- Date to – Default today
- Stores – Default all
- Department – Default all
- Article area – Default all
- Article group – Default all
- Include VAT – Default true
Output:
- Report shows sales statistics tables for selected stores. Each table has a summary for ech column.
- Summary totals in the beginning of new hierarchy level for:
- Department
- Item area
- Item group
Columns:
- EAN
- Item name
- Item num. – Item number
- Quantity sold
- Turnover inc VAT
- Total – Total turnover including VAT
- Share – Share turnover including VAT
- Campaign sale
- Total
- % - Campaign sale percentage
- Gross profit
- Total
- Total % - Total gross profit percentage % exc. Campaign – Gross profit percentage excluding campaign
- Campaign
- Campaign % - Gross profit campaign percentage
Source:
- Lindbak POS Reporting Cube (OLAP)
...
| Expand |
|---|
| title | 0715_TopSalesPerItemWithCompareDate |
|---|
|
CO-10609, PBI#116527  Image Removed Image Removed
Description: Report lists top sales statistics per item with compare selected date. Selections: - Date from – Default todayfirst day of a current week
- Date to – Default today
- Compare date from – Default last year from today
- Compare dat to – Default last year from today
- - Default the same day of week as Date from year before
- Compare date to - Default the same day of week as Date to but year before
- Store Stores – Default all
- Department – Default allArticle area – Default
- Area- Deafult all
- Article group – Default all
- Grouping – Default Depertment
- Number of items – Default 10 items
- Sorting – Default by best
- Measure - Defualt by amount
- Include VAT – Default True
- EAN list – Default empty
- Vendor – Default all
- Subvendor – Default all
- EAN list - Default empty
Output: Report is divided on particular departments by selected grouping. Report has as summary for each department and total summary at the end of tablelists sales in stores in selected period of time and comparison sales in other selected period of time with difference both sales. Report has a summary of each column. Columns: - Store – Store number and name
- Sales w/VAT – Sales amount with VAT
- Sales ex/VAT – Sales net amount excluding VAT
- Gross profit GP
- Dept. – Department
- Area – Article area number
- Grp. – Article group number
- EAN
- Brand
- Item name
- Selected period of time/Comparable period of time
- Quantity
- Turnover
- Gross profit
Gr. prof. % - Gross profit percentage
Clarifications: Negative values are colored red. Source: - Lindbak POS Reporting Cube (OLAP)Lindbak POS Reporting DW
|
| Anchor |
|---|
| 07160711_TurnoverPerHourPerItemSalesPerDepartment0716 |
|---|
| 0711_TurnoverPerHourPerItemSalesPerDepartment |
|---|
|
| Expand |
|---|
| title | 07160711_TurnoverPerHourPerItemSalesPerDepartment |
|---|
|
CO-10608: 10603, PBI#116508PBI#116490
 Image RemovedImage Added Image RemovedImage Added
Description: Report lists turnover per hour for articles in comparison to last yearsales per department with comparison sales. Selections: - Date from – Default todayfirst day of a current week
- Date to – Default today
- Compare date from - Default the same day of week as Date from LY – Default last year from today
- Date to LY – Default last year from today
- Store -Default all
- year before
- Compare date to - Default the same day of week as Date to but year before
- Department – Default all
- Area – Default all
- Article group Store – Default all
- Aggregated values – Default false
- EAN list – Default empty
- Include VAT – Default true
Output: - Report has shows data sales per department for all selected stores and period of time and comparison sales in other period of time.
- together on one report page. Report has a summary at the end of table report for each column and total summary for second table with aggregated values.
- Report has two bar charts: turnover per hour and total turnover with compared bars. On x-axis is respectively each hour and whole slected date. On y-axis is sales amount in time.
Columns: Columns: - No – Department number
- Name – Department name
- Sales
- Gross profit GP
- Hour – Hour of a day
- Quantity
- Turnover
- Share
- Gross profit
- Gr. prof. % - Gross profit percentage
- Diff. qty. sales – Difference quantitysales
- Diff. sales Gross profit – Difference salesGross profit
- Diff. GP % - Difference gross profit percentageGross profit percentage
- Sales amount – Share sales amount
- GP – Share gross profit
Sorting: No – Department number (default sorting) Clarifications: Negative values are colored red. Source: - Lindbak POS Reporting Cube (OLAP)
|
| Anchor |
|---|
| 07170712_ArticleSalesperOperatorSalesPerVendor0717 |
|---|
| 0712_ArticleSalesperOperatorSalesPerVendor |
|---|
|
| Expand |
|---|
| title | 07170712_ArticleSalesperOperatorSalesPerVendor |
|---|
|
CO-10610: 10626, PBI#116539PBI#116469  Image RemovedImage Added Image RemovedImage Added
Description: Report lists article sales per operatorvendor with comparison sales. Selections: - Date from – Default todayfirst day of a current week
- Date to – Default today
- Compare date from - Default the same day of week as Date from year before
- Compare date to - Default the same day of week as Date to but year before
- Store – Default all Department – Default all
- Article area Area – Default all
- Article group – Default all
- EAN list – Default empty
- Include VAT Vendor – Default trueInclude nonsale – Default falseall
Output: Report shows list of sales articles for each cashier in selected storeshas a summary of each column. One page per store. Columns: - Vendor name – Vendor number and name
- Sales w/VAT – Sales amount with VAT
- Sales ex/VAT – Sales net amount excluding
- EAN
- Brand
- Item name
- Quantity
- Sale inc. VAT – Sales including VAT
- Gross profit GP % - Gross profit percentage
Sorting: Vendor No – Vendor number (default sorting) Clarifications: Negative values are colored red. Source: - Lindbak POS Reporting Cube (OLAP)
|
| Anchor |
|---|
| 07180713_DiscountsPerOperatorWithDepartmentSalesPerSubvendor0718 |
|---|
| 0713_DiscountsPerOperatorWithDepartmentSalesPerSubvendor |
|---|
|
| Expand |
|---|
| title | 07180713_DiscountsPerOperatorWithDepartmentSalesPerSubvendor |
|---|
|
CO: 7094210626, PBI#144616PBI#116469  Image RemovedImage Added Image RemovedImage Added
Description: Report lists discount sales per cashier with selected department vendor with comparison sales. Selections: - Date from – Default first day of a current week
- Date to – Default today
- Compare date from - Default the same day of week as Date from year before
- Compare date to - Default the same day of week as Date to but year before
- Store – Default all Department – Default all
- Area – Default all
- Item Article group – Default all
- Date from EAN list – Default today emptyDate to
- Subvendor – Default today all
Output: Report shows summary on quantity and discount columns. has a summary of each column. One page per store. Columns: - Subvendor – Subvendor number and name
- Sales w/VAT – Sales amount with VAT
- Sales ex/VAT – Sales net amount excluding VAT
- Gross profit GP % - Gross profit percentage
Clarifications: Negative values are colored red. Totals in the beginning of new hierarchy level for: Columns: - Buttons for expanding and collapsing all drilldowns.
- EAN
- Item name
- Reason code
- Department
- Quantity
- Discount
- Discount % - Discount percentage
- Ord. price – Ordinary price, amount and discount divided by quantity
- Cashier – Cashier number
Source: - Lindbak POS Reporting Cube (OLAP)
|
| Anchor |
|---|
| 07190714_ExpirationDateInternalUseSalesStatisticsWithDrill0719 |
|---|
| 0714_ExpirationDateInternalUseSalesStatisticsWithDrill |
|---|
|
| Expand |
|---|
| title | 07190714_ExpirationDateInternalUseSalesStatisticsWithDrill |
|---|
|
CO: 115424  Image Removed Image Removed-10606, PBI#116498 Image Added Description: Report lists expiration dates of items including transaction type internal use with reason codesales statistics with drilldowns. Selections: - Date
From - from – Default today
- Date to – Default today
Store - Stores – Default
first avaible store- all
- Department – Default all
- Article area – Default all
- Article group – Default all
- Date type – Default all
- Shelf life date – Default today
All shelf life dates - Include VAT – Default true
Columns: - EAN Item name – Arcticle name
- Item number – Item id
- Cashier
- Date – End date time defining as transaction date
- Net price – Item price exluding VAT
- Price inc VAT – Item price including VAT
- Quantity
- Cost price - NetCost
- Amount
- Gross profit
- Expiration date – shelf life date
- Date type – shelf life date type
- Reason code
- Action code
Output: Raport shows list of items for selected store and departments, and also for selected Article ares and groups. It is one row per EAN and present expiration date including transaction type internal use with reason code. Clarifications: Output: - Report shows sales statistics tables for selected stores. Each table has a summary for ech column.
- Summary totals in the beginning of new hierarchy level for:
- Department
- Item area
- Item group
Columns: - EAN
- Item name
- Item num. – Item number
- Quantity sold
- Turnover inc VAT
- Total – Total turnover including VAT
- Share – Share turnover including VAT
- Campaign sale
- Total
- % - Campaign sale percentage
- Gross profit
- Total
- Total % - Total gross profit percentage % exc. Campaign – Gross profit percentage excluding campaign
- Campaign
- Campaign % - Gross profit campaign percentage
- Report does not contain sum.
- Report is order by expiration date and department.
Source: - Lindbak POS Reporting cube Cube (OLAP)Lindbak POS Reporting DW
|
| Anchor |
|---|
| 07500715_WetStockTopSalesPerItemWithCompareDate0750 |
|---|
| 0715_WetStockTopSalesPerItemWithCompareDate |
|---|
|
| Expand |
|---|
| title | 0750_WetStock | 0715_TopSalesPerItemWithCompareDate |
|---|
|
CO-10609, PBI#116527 Image Added Image Removed Image Removed Description: Report lists wet stock in storestop sales statistics per item with compare selected date. Selections: - Date from – Default first day of current monthDate today
- Date to – Default today
- Compare date from – Default last year from today
- Compare dat to – Default last day of current monthyear from today
- Stores Retail store – Default all
Output: - Department – Default all
- Article area – Default all
- Article group – Default all
- Grouping – Default Depertment
- Number of items – Default 10 items
- Sorting – Default by best
- Measure - Defualt by amount
- Include VAT – Default True
- Vendor – Default all
- Subvendor – Default all
- EAN list - Default empty
Output: Report is divided on particular departments by selected grouping. Report has as summary for each department Each selected store has own table and total summary at the end of table. Columns: - Date
- Opening stock – Actual stock from reading
- Deliveries – Delivery quantity
- Sales – Sales quantity
- Adjustments – Adjustments quantity
- Book Stock – Opening stock and Deliver quantity without sales and adjustment quantity
- Actual Stock
- Water
- Daily Variance
- Daily Variance %
- 5 day cumulative / 31 days cumulative Variance
- Sales
- Variance %
Clarifications: Variance percentage will be red when value different than zero.- Dept. – Department
- Area – Article area number
- Grp. – Article group number
- EAN
- Brand
- Item name
- Selected period of time/Comparable period of time
- Quantity
- Turnover
- Gross profit
- Gr. prof. % - Gross profit percentage
Source: - Lindbak POS Reporting Cube (OLAP)
- Lindbak POS Reporting DW
|
| Anchor |
|---|
| 07510716_DailyWetStockTurnoverPerHourPerItem0751 |
|---|
| 0716_DailyWetStockTurnoverPerHourPerItem |
|---|
|
| Expand |
|---|
| title | 0751_DailyWetStock | 0716_TurnoverPerHourPerItem |
|---|
|
CO-10608, PBI#116508 Image Added Image Removed Image Removed Description: Report lists daily wet stockturnover per hour for articles in comparison to last year. Selections: - Date from – Default first day of current monthtoday
- Date to – Default today
- Date from LY – Default last day of current month
- Retail store – Default select a single store
- year from today
- Date to LY – Default last year from today
- Store -Default all
- Department Article – Default all
Output: Report shows list of fuel tank groups with article name in each group. One page per fuel tank group- Area – Default all
- Article group – Default all
- Aggregated values – Default false
- EAN list – Default empty
- Include VAT – Default true
Output: - Report has shows data for all selected stores together on one report page. Report has a summary at the end of table report for each column and total summary for second table with aggregated values.
- Report has two bar charts: turnover per hour and total turnover with compared bars. On x-axis is respectively each hour and whole slected date. On y-axis is sales amount in time.
Columns: - Date Hour – Date Hour of stocka day
- Opening stock
- Deliveries – Deliveries quantity
- Sales – Sales quantity
- Adjustments – Adjustments quantity
- Book Stock
- Actual Stock
- Water – Water quantity
- Daily Variance – Daily Variance difference
- Daily Variance % - Daile variance difference percentage
- Cumulative Variance
- Cumulative Sale – Cumulative sale quantity
Cumulative Variance %- Quantity
- Turnover
- Share
- Gross profit
- Gr. prof. % - Gross profit percentage
- Diff. qty. – Difference quantity
- Diff. sales – Difference sales
- Diff. GP % - Difference gross profit percentage
Clarifications: Negative values are colored red. Source: - Lindbak POS Reporting Cube (OLAP)
|
| Anchor |
|---|
| 07520717_SalesStatisticsArticleSalesperOperator0752 |
|---|
| 0717_SalesStatisticsArticleSalesperOperator |
|---|
|
| Expand |
|---|
| title | 07520717_SalesStatisticsArticleSalesperOperator |
|---|
|
CO based on report 0714  Image Removed Image Removed
-10610, PBI#116539 Image Added Image Removed Image Removed Description: Report allows to follow up article sales on multiple levels with possibility to select specific hourly intervals and exclude specific item groupslists article sales per operator. Selections: - Date from - – Default today
- Date to - – Default today
- Hour from - Default 0:00
- Hour to - Default 24:00
- Team - Default all
- Store - Default all
- Department - Default all
- Store – Default all
- Department – Default all
- Article area – Article area - Default all
- Article group - – Default all
- EAN list – Default empty
- Include VAT - – Default ontrue
- Include nonsale – Exclude groups - Default false
- Excluded groups - Appears when Exclude groups is switched to true
Output: Article sale statistics for selected stores, for selected date interval and for selected time interval grouped by department, area and group. By default data is shown for department and it is possible to drill down to item level manually by clicng plus button or by using expand all button to expand everithing to item level at onceReport shows list of sales articles for each cashier in selected stores. Columns: - EAN
- Brand
- Buttons for expanding and collapsing all drilldowns.
- EAN - EAN code
- Item name - Article name
- Quantity
- Total- Quantity sold
- Turnover Sale inc. VAT or Turnover ex. VAT depending on selection.
- Total - Amount sold. Inc. or ex. VAT depending on selection
- Share - Share of this department / area / group / item related to total sale.
- Cost price - Cost price
- Gross profit
- Total - Gross profit amount
- – Sales including VAT
- Gross profit GP Total % - Gross profit percentage.
Sorting: - Department number
- Item Area number
- Item Group number
- EAN
Clarifications: - Hour selection applies to each day in selected date period
Article group list is narrowed by selecting article areas. By preventing problems with Excluded groups parameter, report will set all article groups in ExludedGroups (parameter is hidden and switched off until set true by user) if default groups in pExcludedGroupsList are not contain in previously selected article area. If user change article area and want set true on Exclude groups which not containg default groups to exclude, user have to manually choose new article groups to exclude, instead of all selected.
Hidden parameters: Source: - Lindbak POS Reporting Cube (OLAP)
|
| Anchor |
|---|
| 0718_DiscountsPerOperatorWithDepartment |
|---|
| 0718_DiscountsPerOperatorWithDepartment |
|---|
|
| Expand |
|---|
| title | 0718_DiscountsPerOperatorWithDepartment |
|---|
|
CO: 70942, PBI#144616 Image Added Description: Report lists discount per cashier with selected department Selections: - Store – Default all
- Item group – Default all
- Date from – Default today
- Date to – Default today
Output: - Report shows summary on quantity and discount columns.
- Totals in the beginning of new hierarchy level for:
Columns: - Buttons for expanding and collapsing all drilldowns.
- EAN
- Item name
- Reason code
- Department
- Quantity
- Discount
- Discount % - Discount percentage
- Ord. price – Ordinary price, amount and discount divided by quantity
- Cashier – Cashier numberpExcludedGroupsList – Report contain hidden parameter with selected article groups to be exluded by default. This parameter and pExcludedGroups will not work until parameter pExludeGroups will be set as True by user.
Source: - Lindbak POS Reporting cube Cube (OLAP)
|
| Anchor |
|---|
| 07530719_SalesPerHourForArticleExpirationDateInternalUse0753 |
|---|
| 0719_SalesPerHourForArticleExpirationDateInternalUse |
|---|
|
| Expand |
|---|
| title | 07530719_SalesPerHourForArticleExpirationDateInternalUse |
|---|
|
CO-196622, RTC-18368 Image Removed: 115424 Image Removed: 115424 Image Added Description: Report lists turnover per hour for articles in comparison to last yearexpiration dates of items including transaction type internal use with reason code. Selections: - Date
from - From – Default today
- Date to – Default today
Date from LY - Store – Default
last year from today- first avaible store
- Department – Default all
- Article area
- Date to LY – Default last year from today
Team - – Default all
Store -- Article group – Default all
Area - Date type – Default all
Department - Shelf life date – Default
all- Article group – Default all
- Aggregated values – Default false
- EAN list – Default empty
Output: - Report has shows data for all stores together at the beginning and one page per store. Report has a summary at the end of table report for each column and total summary for second table with aggregated values.
- Report has two bar charts: turnover per hour and total turnover with compared bars. On x-axis is respectively each hour and whole slected date. On y-axis is sales amount in time.
Columns: - Hour – Hour of a day
- Quantity
- Turnover
- Share
- Gross profit
- Gr. prof. % - Gross profit percentage
- Diff. qty. – Difference quantity
- Diff. sales – Difference sales
- Diff. GP % - Difference gross profit percentage
Source: - Lindbak POS Reporting Cube (OLAP)
|
...
| title | 0754_TopSalesPerItemWithCompareDate |
|---|
 Image Removed
Description:
Report lists top sales statistics per item with compare date.
Selections:
- Date from – Default today
- Date to – Default today
- Compare date from – Default last year from today
- Compare dat to – Default last year from today
- Hour from – Default 0:00
- Hour to – Default 24:00
- Team – Default all
- Stores – Default all
- Department – Default all
- Article area – Default all
- Article group – Default all
- Grouping – Default Depertment
- Number of items – Default 10 items
- Sorting – Default by best
- Vendor – Default all
- Subvendor – Default all
- Measure - Defualt by amount
- EAN list - Default empty
- Include VAT – Default false
- Exclude groups - Default false
- Excluded groups – Default groups 2 and 92. Appears when Exclude groups is switched to true
Output:
Report shows table for all store on the beginning and one store table per page. Report has a summary for each table at the end of columns.
Columns:
- Dept. – Department
- Area – Article area
- Grp. – Article group
- EAN
- Brand
- Item name
- Selected period of time/Comparable period of time
- Quantity
- Turnover ex. VAT – Turnover excluding VAT
- Gross profit
- Gr. prof. % - Gross profit percentage
- Num of receipts – Number of receipts
Clarifications:
- Negative values are marked red.
- Article group list is narrowed by selecting departments and article areas. By preventing problems with Excluded groups parameter, report will set all article groups in ExludedGroups (parameter is hidden and switched off until set true by user) if default groups in pExcludedGroupsList are not contain in previously selected department or article area. If user change department or article area and want set true on Exclude groups which not containg default groups to exclude, user have to manually choose new article groups to exclude, instead of all selected.
Hidden parameters:
- pExcludedGroupsList – Report contain hidden parameter with selected article groups to be exluded by default. This parameter and pExcludedGroups will not work until parameter pExludeGroups will be set as True by user.
- pAccumulation – Parameter with Values Total and Store (default vaule is total). If default value is store, all stores are selected.
Source:
- Lindbak POS Reporting Cube (OLAP)
- Lindbak POS Reporting DW
- today
- All shelf life dates – Default true
Columns: - EAN Item name – Arcticle name
- Item number – Item id
- Cashier
- Date – End date time defining as transaction date
- Net price – Item price exluding VAT
- Price inc VAT – Item price including VAT
- Quantity
- Cost price - NetCost
- Amount
- Gross profit
- Expiration date – shelf life date
- Date type – shelf life date type
- Reason code
- Action code
Output: Raport shows list of items for selected store and departments, and also for selected Article ares and groups. It is one row per EAN and present expiration date including transaction type internal use with reason code. Clarifications: - Report does not contain sum.
- Report is order by expiration date and department.
Source: - Lindbak POS Reporting cube (OLAP)
- Lindbak POS Reporting DW
|
| Anchor |
|---|
| 0720_StoreSettlementPerOperator |
|---|
| 0720_StoreSettlementPerOperator |
|---|
|
| Expand |
|---|
| title | 0720_StoreSettlementPerOperator |
|---|
|
Standard report  Image Added Image Added
Description: Report allows to follow up store settlement: on first page settlement for all selected cashiers (if all cashiers are selected it equals whole store settlement) and settlement per each cashier on following pages. Report is divided in 12 subreports which will be descriped separatly below. Selections (applies to all subreports): - Date from: Default today
- Date to: Default today
- Store: Single value; default first available from the list.
- Operator: Multivalue; default all
- Price channels: Multivalue; default all
Subreports:
| Expand |
|---|
| 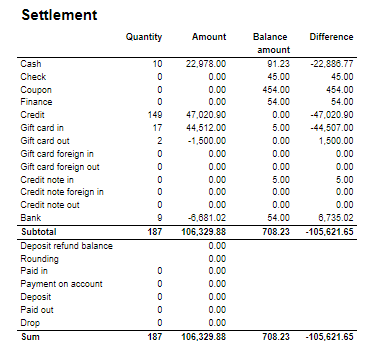 Image Added Image Added
Columns: - Quantity
- Amount
- Balance amount
- Difference: Balance amount - Amount
Rows: One row per tender type . In means received, out means given (returns etc...) - Cash: Tender type key = Cash or CashBack
- Check
- Coupon
- Finance
- Credit
- Gift card in
- Gift card out
- Gift card foreign in
- Gift card foreign out
- Credit note in
- Credit note foreign in
- Credit note out
- Bank: Tender Type Key = CreditDebit or CreditDebitOffline or ECreditDebit
- Subtotal: Total for all rows above Subtotal
______________________________________________________________________________________ - Deposit refound balance: Tender type key DepositRefund received - DepositRefund given
- Rounding: Subtotal rounding
- Paid in: Tender Control Type Key: PayedIn
- Payment on account: Tender Control Type Key: PaymentOnAccount
- Deposit: Article Type Key: Deposit
- Paid out: Tender Control Type Key: PayedOut
- Drop: Tender Control Type Key: Drop
|
| Expand |
|---|
| title | 1005_subDepositRefound |
|---|
| Image Added Columns: - Amount: Sales amount inc. VAT
- Qunatity: Number of receipts.
Rows: - Deposit refund received: Amount (or number of receipts) for direction in for Article Type Key: DepositRefund
- Deposit refund sold: Amount (or number of receipts) for direcion out for Article Type Key: DepositRefund
- Deposit refund balance: Received - sold
|
| Expand |
|---|
| Image Added Columns: - Qunatity
- Qunatity %: Share of given tender type quantity in whole quantity
- Amount: Sales inc. VAT per tender type
Rows: - One row per one tender type
|
| Expand |
|---|
| Image Added Columns: - Paymentcard – Type of paymentcard
- Quantity – Tender count
- Amount – Tender amount
Output: - Subreport lists one row per type of payment card.
- Table has a total summary quantity and amount for all payment cards.
|
| Expand |
|---|
| Image Added
Columns: - Sales amount With VAT:
- Sales amount Campaign: Sale amount inc. VAT for campaigns with discount keys: CampaignPrice, Group, MemberPrice
- Sales amount campaign %: Share of campain sales in all sales (Sales amount Campaign / Sales amount With VAT)
- Gross profit Amount
- Gross profit In %: Share of Gross profit in Net Amount
- Gross profit Campaign: Gross profit for Campaign
- Gross profit Campaign %: Share of gross profit for campains in campaign sales (Gross profit Campaign/ Sales amount Campaign)
Rows: |
| Expand |
|---|
| title | 1012_subTaxAccounting |
|---|
| 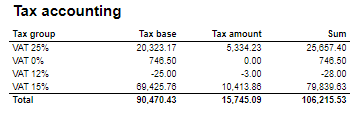 Image Added Image Added
Columns: - Tax group: tax type
- Tax base: Net amount
- Tax amount: tax
- Sum: Turnover inc. VAT
Rows: |
| Expand |
|---|
| 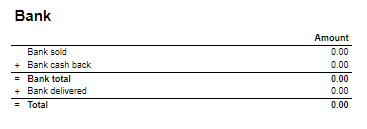 Image Added Image Added
Rows: - Bank sold: Sales amount for tender types: CreditDebit, CreditDebitOffline, ECreditDebit
- Bank cash back: tender type Cash back
- Bank delivered: tender type: DeliveredBalance
|
| Expand |
|---|
| title | 1003_subBankSettlement |
|---|
| 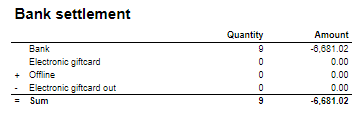 Image Added Image Added
Rows: - Bank: Amount for tender types: CreditDebit, CreditDebitOffline, ECreditDebit, Cash back
- Electronic giftcard: Amount for few hard coded payment card keys
- Offline: Amount for CreditDebitOffline
- Electronic giftcard out: Outcoming amount for few hard coded payment card keys
|
| Expand |
|---|
| Image Added Rows: - Credit note sold: Quantity/ Amount of sold by store credit notes
- Credit note used: Credit notes used in the store
- Credit note foreign used: Foreign credit notes used in the store
|
| Expand |
|---|
| 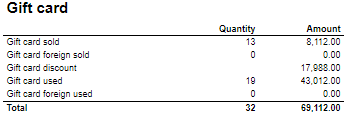 Image Added Image Added
Columns: - Quantity: number of gift cards
- Amount: Amount on gift cards
Rows: - Gift Card sold: Gift cards sold by given operator in given store
- Gift card foreign sold: Foreign gift cards sold by given operator in given store
- Gift card discount:
- Gift card used: Sales amount inc. VAT made with gift cards. (Number of transactions made with gift cards)
- Gift card foreign used: Sales amount inc. VAT made with foreign gift cards. (Number of transactions made with foreign gift cards)
|
| Expand |
|---|
| Image Added Rows: - Gross sale amount: Amount inc. VAT
Total%: - Deposit refund: Deposit refound amount / Gross sale amount
- Returned items: Returned items amount/ Gross sale amount
- Deleted sales: Deleted amount/ Gross sale amount
- Deleted reciept: Deleted receipts amount/ Gross sale amount
- Scanned: Scanned quantity/ Gross sale qunatity
|
| Expand |
|---|
| Image Added Columns: - Amount: Discount amount
- Quantity: quantity of items sold with given discount
- Total %: Share of given discount amount in all discounts amount
Rows: - One row per one type of discount
|
Source: - Lindbak POS Reporting cube (OLAP)
|
| Anchor |
|---|
| 0721_StoreSettlementPerWorkstation |
|---|
| 0721_StoreSettlementPerWorkstation |
|---|
|
| Expand |
|---|
| title | 0721_StoreSettlementPerWorkstation |
|---|
|
 Image Added Image Added
Description: Report allows to follow up store settlement: on first page settlement for all selected workstations and settlement per each workstation on following pages. Report is divided in 15 subreports which will be descriped separatly below. Selections (applies to all subreports): - Date from: Default today
- Date to: Default today
- Store: Single value; default first available from the list.
- Workstation: Multivalue; default all
Subreports:
| Expand |
|---|
| Image Added Columns: - Quantity
- Amount
- Balance amount
- Difference: Balance amount - Amount
Rows: One row per tender type . In means received, out means given (returns etc...) - Cash: Tender type key = Cash or CashBack
- Check
- Coupon
- Finance
- Credit
- Gift card in
- Gift card out
- Gift card foreign in
- Gift card foreign out
- Credit note in
- Credit note foreign in
- Credit note out
- Bank: Tender Type Key = CreditDebit or CreditDebitOffline or ECreditDebit
- Subtotal: Total for all rows above Subtotal
______________________________________________________________________________________ - Deposit refound balance: Tender type key DepositRefund received - DepositRefund given
- Rounding: Subtotal rounding
- Paid in: Tender Control Type Key: PayedIn
- Payment on account: Tender Control Type Key: PaymentOnAccount
- Deposit: Article Type Key: Deposit
- Paid out: Tender Control Type Key: PayedOut
- Drop: Tender Control Type Key: Drop
|
| Expand |
|---|
| title | 1005_subDepositRefund |
|---|
| Image Added Columns: - Amount: Sales amount inc. VAT
- Qunatity: Number of receipts.
Rows: - Deposit refund received: Amount (or number of receipts) for direction in for Article Type Key: DepositRefund
- Deposit refund sold: Amount (or number of receipts) for direcion out for Article Type Key: DepositRefund
- Deposit refund balance: Received - sold
|
| Expand |
|---|
| Image Added Columns: - Qunatity
- Qunatity %: Share of given tender type quantity in whole quantity
- Amount: Sales inc. VAT per tender type
Rows: - One row per one tender type
|
| Expand |
|---|
| Image Added Columns: - Paymentcard – Type of paymentcard
- Quantity – Tender count
- Amount – Tender amount
Output: - Subreport lists one row per type of payment card.
- Table has a total summary quantity and amount for all payment cards.
|
| Expand |
|---|
| title | 1008_subSettlement_2 |
|---|
| Image Added Rows: - Gross amount: Amount inc. VAT + General discount - Returns
- Deducted bonus check: Return amount on article group set in hidden parameter: pBonusCheckArticleGroup
- Return total: All rerutns amount - Deducted bonus check
- General discount: Discount amount with keys: Line and Subtotal
__________________________________________________________________________________ - Net amount - 0% tax: Net amount with 0% tax
- Net amount - other taxes: Net amount
- Tax total: tax amount
- Rounding: Subtotal rounding amount
__________________________________________________________________________________ - Net amount rounded: both Net amounts + Rounding
- Shoes serviece (Store cost and total): balance amount with tender type: InboundChangeBalance; Sales inc. VAT per article with article type: Service
- Inbound change: Return amount per article with article type: Service
- Outbound change: Remaining Amoun tIn Drawer; difference: Remaining Amoun tIn Drawer - balance amount with tender type: InboundChangeBalance
|
| Expand |
|---|
| title | 1000_subArticleSales |
|---|
| Image Added Columns: - Sales amount With VAT:
- Sales amount Campaign: Sale amount inc. VAT for campaigns with discount keys: CampaignPrice, Group, MemberPrice
- Sales amount campaign %: Share of campain sales in all sales (Sales amount Campaign / Sales amount With VAT)
- Gross profit Amount
- Gross profit In %: Share of Gross profit in Net Amount
- Gross profit Campaign: Gross profit for Campaign
- Gross profit Campaign %: Share of gross profit for campains in campaign sales (Gross profit Campaign/ Sales amount Campaign)
Rows: |
| Expand |
|---|
| title | 1012_subTaxAccounting |
|---|
| Image Added Columns: - Tax group: tax type
- Tax base: Net amount
- Tax amount: tax
- Sum: Turnover inc. VAT
Rows: |
| Expand |
|---|
| Image Added Rows: - Bank sold: Sales amount for tender types: CreditDebit, CreditDebitOffline, ECreditDebit
- Bank cash back: tender type Cash back
- Bank delivered: tender type: DeliveredBalance
|
| Expand |
|---|
| title | 1003_subBankSettlement |
|---|
| Image Added Rows: - Bank: Amount for tender types: CreditDebit, CreditDebitOffline, ECreditDebit, Cash back
- Electronic giftcard: Amount for few hard coded payment card keys
- Offline: Amount for CreditDebitOffline
- Electronic giftcard out: Outcoming amount for few hard coded payment card keys
|
| Expand |
|---|
| Image Added Rows: - Credit note sold: Quantity/ Amount of sold by store credit notes
- Credit note used: Credit notes used in the store
- Credit note foreign used: Foreign credit notes used in the store
|
| Expand |
|---|
| Image Added Columns: - Quantity: number of gift cards
- Amount: Amount on gift cards
Rows: - Gift Card sold: Gift cards sold by given operator in given store
- Gift card foreign sold: Foreign gift cards sold by given operator in given store
- Gift card discount
- Gift card used: Sales amount inc. VAT made with gift cards. (Number of transactions made with gift cards)
- Gift card foreign used: Sales amount inc. VAT made with foreign gift cards. (Number of transactions made with foreign gift cards)
|
| Expand |
|---|
| Image Added Rows: - Gross sale amount: Amount inc. VAT
Total%: - Deposit refund: Deposit refound amount / Gross sale amount
- Returned items: Returned items amount/ Gross sale amount
- Deleted sales: Deleted amount/ Gross sale amount
- Deleted reciept: Deleted receipts amount/ Gross sale amount
- Scanned: Scanned quantity/ Gross sale qunatity
|
| Expand |
|---|
| Image Added Columns: - Amount: Discount amount
- Quantity: quantity of items sold with given discount
- Total %: Share of given discount amount in all discounts amount
Rows: - One row per one type of discount
|
| Expand |
|---|
| title | 1014_subReturnReasonCodes |
|---|
| Image Added Description: Amount inc. VAT and quantity of items returned. One row per reason code. |
| Expand |
|---|
| Image Added Description: Nonsale Amount and number of transactions per article. Clarification: Articles to displayed can be narrowed down by changing parameter: pArticlesSet |
Source: - Lindbak POS Reporting cube (OLAP)
|
| Anchor |
|---|
| 0750_WetStock |
|---|
| 0750_WetStock |
|---|
|
| Expand |
|---|
|
Image Added Description: Report lists wet stock in stores. Selections: - Date from – Default first day of current month
- Date to – Default last day of current month
- Retail store – Default all
Output: Each selected store has own table and total summary at the end of table. Columns: - Date
- Opening stock – Actual stock from reading
- Deliveries – Delivery quantity
- Sales – Sales quantity
- Adjustments – Adjustments quantity
- Book Stock – Opening stock and Deliver quantity without sales and adjustment quantity
- Actual Stock
- Water
- Daily Variance
- Daily Variance %
- 5 day cumulative / 31 days cumulative Variance
- Sales
- Variance %
Clarifications: Variance percentage will be red when value different than zero. Source: - Lindbak POS Reporting Cube (OLAP)
|
| Anchor |
|---|
| 0751_DailyWetStock |
|---|
| 0751_DailyWetStock |
|---|
|
| Expand |
|---|
|
Image Added Description: Report lists daily wet stock Selections: - Date from – Default first day of current month
- Date to – Default last day of current month
- Retail store – Default select a single store
- Article – Default all
Output: Report shows list of fuel tank groups with article name in each group. One page per fuel tank group. Columns: - Date – Date of stock
- Opening stock
- Deliveries – Deliveries quantity
- Sales – Sales quantity
- Adjustments – Adjustments quantity
- Book Stock
- Actual Stock
- Water – Water quantity
- Daily Variance – Daily Variance difference
- Daily Variance % - Daile variance difference percentage
- Cumulative Variance
- Cumulative Sale – Cumulative sale quantity
- Cumulative Variance %
Source: - Lindbak POS Reporting Cube (OLAP)
|
| Anchor |
|---|
| 0752_SalesStatistics |
|---|
| 0752_SalesStatistics |
|---|
|
| Expand |
|---|
| title | 0752_SalesStatistics |
|---|
|
CO based on report 0714 Image Added Image Added Description: Report allows to follow up article sales on multiple levels with possibility to select specific hourly intervals and exclude specific item groups. Selections: - Date from - Default today
- Date to - Default today
- Hour from - Default 0:00
- Hour to - Default 24:00
- Team - Default all
- Store - Default all
- Department - Default all
- Article area - Default all
- Article group - Default all
- Include VAT - Default on
- Exclude groups - Default false
- Excluded groups - Appears when Exclude groups is switched to true
Output: Article sale statistics for selected stores, for selected date interval and for selected time interval grouped by department, area and group. By default data is shown for department and it is possible to drill down to item level manually by clicng plus button or by using expand all button to expand everithing to item level at once. Columns: - Buttons for expanding and collapsing all drilldowns.
- EAN - EAN code
- Item name - Article name
- Quantity
- Total- Quantity sold
- Turnover inc. VAT or Turnover ex. VAT depending on selection.
- Total - Amount sold. Inc. or ex. VAT depending on selection
- Share - Share of this department / area / group / item related to total sale.
- Cost price - Cost price
- Gross profit
- Total - Gross profit amount
- Total % - Gross profit percentage.
Sorting: - Department number
- Item Area number
- Item Group number
- EAN
Clarifications: - Hour selection applies to each day in selected date period
Article group list is narrowed by selecting article areas. By preventing problems with Excluded groups parameter, report will set all article groups in ExludedGroups (parameter is hidden and switched off until set true by user) if default groups in pExcludedGroupsList are not contain in previously selected article area. If user change article area and want set true on Exclude groups which not containg default groups to exclude, user have to manually choose new article groups to exclude, instead of all selected.
Hidden parameters: Source: - Lindbak POS Reporting cube (OLAP)
|
| Anchor |
|---|
| 0753_SalesPerHourForArticle |
|---|
| 0753_SalesPerHourForArticle |
|---|
|
| Expand |
|---|
| title | 0753_SalesPerHourForArticle |
|---|
|
CO-196622, RTC-18368 Image Added Description: Report lists turnover per hour for articles in comparison to last year. Selections: - Date from – Default today
- Date to – Default today
- Date from LY – Default last year from today
- Date to LY – Default last year from today
- Team – Default all
- Store -Default all
- Area – Default all
- Department – Default all
- Article group – Default all
- Aggregated values – Default false
- EAN list – Default empty
Output: - Report has shows data for all stores together at the beginning and one page per store. Report has a summary at the end of table report for each column and total summary for second table with aggregated values.
- Report has two bar charts: turnover per hour and total turnover with compared bars. On x-axis is respectively each hour and whole slected date. On y-axis is sales amount in time.
Columns: - Hour – Hour of a day
- Quantity
- Turnover
- Share
- Gross profit
- Gr. prof. % - Gross profit percentage
- Diff. qty. – Difference quantity
- Diff. sales – Difference sales
- Diff. GP % - Difference gross profit percentage
Source: - Lindbak POS Reporting Cube (OLAP)
|
| Anchor |
|---|
| 0754_TopSalesPerItemWithCompareDate |
|---|
| 0754_TopSalesPerItemWithCompareDate |
|---|
|
| Expand |
|---|
| title | 0754_TopSalesPerItemWithCompareDate |
|---|
|
Image Added Description: Report lists top sales statistics per item with compare date. Selections: - Date from – Default today
- Date to – Default today
- Compare date from – Default last year from today
- Compare dat to – Default last year from today
- Hour from – Default 0:00
- Hour to – Default 24:00
- Team – Default all
- Stores – Default all
- Department – Default all
- Article area – Default all
- Article group – Default all
- Grouping – Default Depertment
- Number of items – Default 10 items
- Sorting – Default by best
- Vendor – Default all
- Subvendor – Default all
- Measure - Defualt by amount
- EAN list - Default empty
- Include VAT – Default false
- Exclude groups - Default false
- Excluded groups – Default groups 2 and 92. Appears when Exclude groups is switched to true
Output: Report shows table for all store on the beginning and one store table per page. Report has a summary for each table at the end of columns. Columns: - Dept. – Department
- Area – Article area
- Grp. – Article group
- EAN
- Brand
- Item name
- Selected period of time/Comparable period of time
- Quantity
- Turnover ex. VAT – Turnover excluding VAT
- Gross profit
- Gr. prof. % - Gross profit percentage
- Num of receipts – Number of receipts
Clarifications: - Negative values are marked red.
- Article group list is narrowed by selecting departments and article areas. By preventing problems with Excluded groups parameter, report will set all article groups in ExludedGroups (parameter is hidden and switched off until set true by user) if default groups in pExcludedGroupsList are not contain in previously selected department or article area. If user change department or article area and want set true on Exclude groups which not containg default groups to exclude, user have to manually choose new article groups to exclude, instead of all selected.
Hidden parameters: - pExcludedGroupsList – Report contain hidden parameter with selected article groups to be exluded by default. This parameter and pExcludedGroups will not work until parameter pExludeGroups will be set as True by user.
- pAccumulation – Parameter with Values Total and Store (default vaule is total). If default value is store, all stores are selected.
Source: - Lindbak POS Reporting Cube (OLAP)
- Lindbak POS Reporting DW
|
| Anchor |
|---|
| 0755_TopSalesPerItem |
|---|
| 0755_TopSalesPerItem |
|---|
|
| Expand |
|---|
| title | 0755_TopSalesPerItem |
|---|
|
CO: 207212. Based on report 0754  Image Added Image Added
Description: Report allows to find given number of best or worst selling items on multiple levels (amount, quantity, gross profit) in two date intervals. Possible to select specific hourly interval. Selections: - Date from - Default today
- Date to - Default today
- Compare date from - Default the same day of week as Date from year before
- Compare date to- Default the same day of week as Date to but year before
- Hour from - Default 0:00
- Hour to - Default 24:00
- Team - Default all
- Store - Default all
- Department - Default all
- Article area - Default all
- Article group - Default all
- Number of items - Number of best or worst items to display - default 10
- Sort type - worst or best - report will display given number of worst or best selling items - default best
- Sort measure - amount/quantity/net cost/gross profit/gross profit % - set the measure on which the items are sorted. - default amount
- Vendor - default all
- Subvendor- default all
- Include VAT - Default on
- Exclude groups - Default false
- Excluded groups - Appears when Exclude groups is switched to true
Output: Sale statistics for selected number of best or worst items per store sorted by selected sort measure devided in two selected date intervals in selected hour range. Columns: - Store
- Dept. - Department
- Area
- Grp. - Item group
- EAN
- Item name
- Quantity
- Turnover ex. VAT
- Gross profit
- Gross profit %
- Num of receipts
Sorting: Clarifications: - Hour selection applies to each day in selected date period
- Negative values are colored red
Article group list is narrowed by selecting departments and article areas. By preventing problems with Excluded groups parameter, report will set all article groups in ExludedGroups (parameter is hidden and switched off until set true by user) if default groups in pExcludedGroupsList are not contain in previously selected department or article area. If user change department or article area and want set true on Exclude groups which not containg default groups to exclude, user have to manually choose new article groups to exclude, instead of all selected.
Hidden parameters: Source: - Lindbak POS Reporting cube (OLAP)
- Lindbak POS Reporting DW
|
| Anchor |
|---|
| 0756_CreditSalesWithPaymentsOnAccount |
|---|
| 0756_CreditSalesWithPaymentsOnAccount |
|---|
|
| Expand |
|---|
| title | 0756_CreditSalesWithPaymentsOnAccount |
|---|
|
CO: 208778. Based on report 0650  Image Added Image Added
Description: Report shows credit sales and payments on account to get a better overview over drive-offs. Selections: - Date from - Default today
- Date to - Default today
- Team - Default all
- Retail store - Default all available in selected team
Output: One row per transaction grouped by store and customer. Page break and total for each store. Columns: - Date - date of the transaction,
- Receipt - receipt number of the transaction,
- Ref.no - reference number of the credit tender transaction,
- Ref.text - reference text of the credit tender transaction,
- Amount - amount inc. VAT of the credit tender transaction,
- Tax amount - VAT amount from articles,
- On account - payments when using payment on account function in POS.
Sorting: - Store number
- Customer key
- Transaction date
Clarifications: Transaction can be either Credit sale or Payment on account. If transaction is Payment on account there is no data available for columns: Ref.no and Ref.text Source:
|
| Anchor |
|---|
| 0757_MixSales |
|---|
| 0757_MixSales |
|---|
|
| Expand |
|---|
|
 Image Added Image Added
Description: Reports lists mix coupons for selected stores in selected period of time. Selections: - Date from - Default today
- Date to - Default today
- Profile - Default all
- Team - Default all
- Store - Default all
- Mix - Default all
Output: Report shows extended mixmatch sales statistics. For one page per store there is a list grouped by mix. Report has a total summaty at the end of table. Columns: - Mix - Mix number and mix name
- EAN
- Item name
- Department
- Item area
- Item group
- % of total sales - Percentage of total turnover excluding VAT
- Items sold - Number of items sold in mix
- % items sold - Percetnage of item sold in mix
- Discount ex. VAT - Mix discounts excluding VAT
- Receipts with mix
- Share mix receipts - Share of mix receipts
- Amount in mix receipts ex. VAT - Amount in mix receipts excluding VAT
- Avg. sales customer - Average sales customer
- Gr. prof. % mix - Gross profit percentage mix
- Gr. prof. % total - Gross profit percentage total
- Gross profit
Clarifications: Report has a star explanation for a few columns. It means that summary values for particular mix are calculated including all transactions in store. As an example '% Items sold' is calculating by taking quantity and dividing it by whole store quantity. For whole mix it will be store quantity of all items in store. For particular article in that mix '% Items sold', quantity of that product in mix will be divided by all articles in that mix. Summary for mix (grey grouped row) takes whole statistics about store, even if it is not mix. Source: - Lindbak POS Reporting Cube (OLAP)
|
| Anchor |
|---|
| 0758_SalesPerHour |
|---|
| 0758_SalesPerHour |
|---|
|
| Expand |
|---|
|
CO-271850 based on 0603_SalesPerHour
 Image Added Image Added
Description: Report lists sales per hour with counting customer inside and outside. It also compares inside / outside data with selected period. Selections: - Periode – default month
- Year – Default current year
- Month – Default current month
- Week – Default current week
- Date from – Default today
- Date to – Default today
- Compare date from - Default yesterday.
- Compare date to - Default yesterday.
- Profile – Default all
- Team – Default all
- Store – Default all
- Exclude groups – Default false
- Excluded groups – Default list of excluded groups
Parameters: - pExcludedGroupsList - Parameter to create list of itemgroups to use in excluded groups selection (<name>;<itemgroupnumber>,<name>;<itemgroupnumber>). Default = Bilvask;93
- pPriceChannelIn - Parameter to define pricechannel for inside customers. Default = [Price Channel].[Price Channel Key].&[Cashier]
- pPriceChannelOut - Parameter to define pricechannel for outside customers. Default = [Price Channel].[Price Channel Key].&[ShopAndGoCheckTerminal]
- pHourFrom and pHourTo - Parameters to define which hours should be shown in report. Default 0 - 23.
Output: - Report has a summary at the end of table on each column.
- Summary totals in the beginning of new hierarchy level for store.
Columns: - Hour – Hour of a day
- Sales – Sales amount
- Net cost
- VAT – VAT amount
- Gr. prof. % - Gross profit percentage
- Share
- Items – Sales quantity
- Quantity - Customer inside/Customer outside quantity for period and comparison period
- Sale per customer - Customer inside/Customer outside sale per customer for period and comparison period
- Sales/item – Sales amount divided by item quantity Items per customer
- Items per customer
- Sales – Campaign sales amount
- Items – Campaign item quantity
- Customers – Campaign customer count
Source: - Lindbak POS Reporting DW
- Lindbak POS Reporting Cube (OLAP)
|
| Anchor |
|---|
| 0780_DailyReport |
|---|
| 0780_DailyReport |
|---|
|
| Expand |
|---|
|
Standard report  Image Added Image Added
 Image Added Image Added
Description: Report allows to follow up sales in a specified store: comparing fuel and non fuel articles on all product groups, selected tender measures, VAT and measures like: cash balance, card movements, card sales and shift statistics. Depending on number of results it can be multi page. Report is divided in 8 subreports which will be descriped separatly below. Selections (applies to all subreports): - Date from: Default yesterday
- Date to: Default yesterday
- Store: Single value; Default first available from the list.
Hidden parameters: - pFuelItemType - Item type number used to identify fuel items - Default: [Article].[Item Type].&[10]
- pPriceChannelOutdoor - Price channel number (in Reporting) used to identify outdoor sales - Default: [Price Channel].[Price Channel].&[11]
- pReasonCodeBreakage - Reason code name used to identify Driveoff - Default: [Reason Code].[Reason Code].&[Avstikk]&[Return]
Subreports:
| Expand |
|---|
| title | 1801_subItemGroupSales |
|---|
|  Image Added Image Added
Columns: - Item Group Name
- Item Group Number
- Quantity
- Amount
Rows: - One row per item group with divide to fuel and non fuel.
- Subtotal: Total for all rows above Subtotal
______________________________________________________________________________________ |
| Expand |
|---|
| title | 1802_subProductSales |
|---|
|  Image Added Image Added
Columns: - Item Group Name
- Item Group Number
- Quantity
- Amount
Rows: - Subtotal Fuel
- Subtotal Non Fuel
______________________________________________________________________________________
|
| Expand |
|---|
|  Image Added Image Added
Columns: - Tender Type
- Quantity
- Amount
Rows: - Cash
- Outdoor Cash
- Indoor Cash
- Credit
- Other
- Rounding
_____________________________________________________________________________________ |
| Expand |
|---|
|  Image Added Image Added
Columns: - VAT
- Tax Amount
- Net Amount
- Amount
Rows: - One row per VAT with divide to fuel and non fuel.
- Subtotal: Total for all rows above Subtotal
______________________________________________________________________________________ |
| Expand |
|---|
| title | 1805_subCardMovement |
|---|
|  Image Added Image Added
Columns: - Tender Type
- Quantity
- Amount
Rows: - Card
Cashback - Station Credit Payment
- In Payment
_____________________________________________________________________________________ |
| Expand |
|---|
|  Image Added Image Added
Columns: - Tender Type
- Quantity
- Amount
Rows: - Cash
- Cashback
- Drop
- Paid In
- Paid Out
- Station Credit Payment
_____________________________________________________________________________________ - Total (Cash - Cashback - Drop + Paid In + Paid Out(negative) - Station Credit Payment)
- Balance Amount Cash
_____________________________________________________________________________________ - Difference (Balance Amount Cash - Total)
|
| Expand |
|---|
|  Image Added Image Added
Columns: - Card Number
- Card Name
- Quantity Outdoor
- Amount Outdoor
- Quantity Indoor
- Amount Indoor
- Quantity
- Amount
Rows: ______________________________________________________________________________________ |
| Expand |
|---|
| title | 1808_subShiftStatistics |
|---|
|  Image Added Image Added
Columns: - Tender Type Grouping
- Tender Type
- Quantity
- Amount
Rows: _____________________________________________________________________________________ _____________________________________________________________________________________ _____________________________________________________________________________________ _____________________________________________________________________________________ _____________________________________________________________________________________ _____________________________________________________________________________________ - Miscellaneous
- Cancelled Receipts
- Drive Off
- Pos Shift Count
|
Source: - Lindbak POS Reporting cube (OLAP)
|
| Anchor |
|---|
| 0790_CashierStatistics |
|---|
| 0790_CashierStatistics |
|---|
|
| Expand |
|---|
| title | 0790_CashierStatistics |
|---|
|
[RTC-39849] TRN: Cashier security statistics report with turnover split and price checks - EG A/S  Image Added Image Added
Description: - Report allows to follow up Cashiers sales and selected activities.
Selections: - Date from: Default today
- Date to: Default today
- Retail store: Default all
- Operator: Default all
Output: One page per store One row per cashier Columns: - No: Operator number
- Name: Operator name
- Tender (NB! this is tender data and does not represent turnover).
- Cash
- Other (ohter than cash)
- Receipts: number of reciepts
- Returns
- Deleted receipts
- Deleted item lines
- Receipts on hold
- Null: Number of drawer opening without any transaction
- Ovr. prc.: Overriden price count
- Scan %: Scan divided by Quantity of sold items
- Discount: Discount quantity
- Price check: How many times price check funtion is used.
Sorting: Source: - Lindbak POS Reporting cube
|
...
| title | 0755_TopSalesPerItem |
|---|
CO: 207212. Based on report 0754
Image Removed
Description:
Report allows to find given number of best or worst selling items on multiple levels (amount, quantity, gross profit) in two date intervals. Possible to select specific hourly interval.
Selections:
- Date from - Default today
- Date to - Default today
- Compare date from - Default the same day of week as Date from year before
- Compare date to- Default the same day of week as Date to but year before
- Hour from - Default 0:00
- Hour to - Default 24:00
- Team - Default all
- Store - Default all
- Department - Default all
- Article area - Default all
- Article group - Default all
- Number of items - Number of best or worst items to display - default 10
- Sort type - worst or best - report will display given number of worst or best selling items - default best
- Sort measure - amount/quantity/net cost/gross profit/gross profit % - set the measure on which the items are sorted. - default amount
- Vendor - default all
- Subvendor- default all
- Include VAT - Default on
- Exclude groups - Default false
- Excluded groups - Appears when Exclude groups is switched to true
Output:
Sale statistics for selected number of best or worst items per store sorted by selected sort measure devided in two selected date intervals in selected hour range.
Columns:
- Store
- Dept. - Department
- Area
- Grp. - Item group
- EAN
- Item name
- Quantity
- Turnover ex. VAT
- Gross profit
- Gross profit %
- Num of receipts
Sorting:
Clarifications:
- Hour selection applies to each day in selected date period
- Negative values are colored red
Article group list is narrowed by selecting departments and article areas. By preventing problems with Excluded groups parameter, report will set all article groups in ExludedGroups (parameter is hidden and switched off until set true by user) if default groups in pExcludedGroupsList are not contain in previously selected department or article area. If user change department or article area and want set true on Exclude groups which not containg default groups to exclude, user have to manually choose new article groups to exclude, instead of all selected.
Hidden parameters:
pExcludedGroupsList – Report contain hidden parameter with selected article groups to be exluded by default. This parameter and pExcludedGroups will not work until parameter pExludeGroups will be set as True by user.
Source:
- Lindbak POS Reporting cube (OLAP)
- Lindbak POS Reporting DW
...
| title | 0756_CreditSalesWithPaymentsOnAccount |
|---|
CO: 208778. Based on report 0650
Image Removed
Description:
Report shows credit sales and payments on account to get a better overview over drive-offs.
Selections:
- Date from - Default today
- Date to - Default today
- Team - Default all
- Retail store - Default all available in selected team
Output:
One row per transaction grouped by store and customer. Page break and total for each store.
Columns:
- Date - date of the transaction,
- Receipt - receipt number of the transaction,
- Ref.no - reference number of the credit tender transaction,
- Ref.text - reference text of the credit tender transaction,
- Amount - amount inc. VAT of the credit tender transaction,
- Tax amount - VAT amount from articles,
- On account - payments when using payment on account function in POS.
Sorting:
- Store number
- Customer key
- Transaction date
Clarifications:
Transaction can be either Credit sale or Payment on account. If transaction is Payment on account there is no data available for columns: Ref.no and Ref.text
Source:
...
| Expand |
|---|
|
Image Removed Description: Reports lists mix coupons for selected stores in selected period of time. Selections: - Date from - Default today
- Date to - Default today
- Profile - Default all
- Team - Default all
- Store - Default all
- Mix - Default all
Output: Report shows extended mixmatch sales statistics. For one page per store there is a list grouped by mix. Report has a total summaty at the end of table. Columns: - Mix - Mix number and mix name
- EAN
- Item name
- Department
- Item area
- Item group
- % of total sales - Percentage of total turnover excluding VAT
- Items sold - Number of items sold in mix
- % items sold - Percetnage of item sold in mix
- Discount ex. VAT - Mix discounts excluding VAT
- Receipts with mix
- Share mix receipts - Share of mix receipts
- Amount in mix receipts ex. VAT - Amount in mix receipts excluding VAT
- Avg. sales customer - Average sales customer
- Gr. prof. % mix - Gross profit percentage mix
- Gr. prof. % total - Gross profit percentage total
- Gross profit
Clarifications: Report has a star explanation for a few columns. It means that summary values for particular mix are calculated including all transactions in store. As an example '% Items sold' is calculating by taking quantity and dividing it by whole store quantity. For whole mix it will be store quantity of all items in store. For particular article in that mix '% Items sold', quantity of that product in mix will be divided by all articles in that mix. Summary for mix (grey grouped row) takes whole statistics about store, even if it is not mix. Source: - Lindbak POS Reporting Cube (OLAP)
|
| Anchor |
|---|
| 0800_TopXArticlesSold |
|---|
| 0800_TopXArticlesSold |
|---|
|
...