Description:
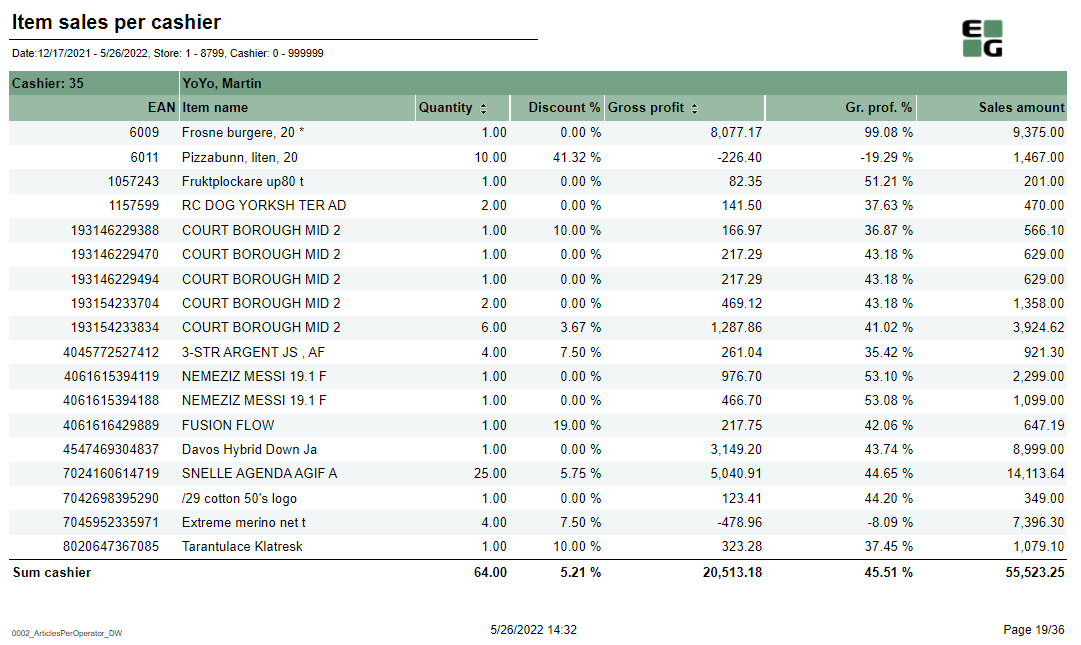
- Report allows to follow up cashiers sale performance.
Selections:
- Date from - Default today
- Date to - Default today
- Retail store from - Default 1
- Retail store to - Default 1
- Operator from - Default 0
- Operator to - Default 999999
Output:
Item sale statistics showed individually per each cashier (with number between Operator from and Operator to) per each stores (with number between Retail store from and Retail store to).
Additionally there are totals for each cashier and each store.
Columns:
- EAN
- Item name
- Quantity
- Discount % - Share of discount amount in original prize
- Gross profit
- Gross profit % - (gross profit)/(sales ex. VAT)
- Sales amount
Sorting:
- EAN (default)
- Qunatity (interactive)
- Gross profit (interactive)
Source: Lindbak POS Reporting DW

Description:
Report allows to follow up bonus rollout checks usage and sales made using bonus checks.
Selections:
- Year from (default last year)
- Year to (default current year)
- Bonus rollout name (default all) - report shows data for available rollouts within selected period
- Loyalty program
Output:
Bonus checks usage and sales statistics grouped per store. Report lists all the stores in which checks were issued or redeemed.
Columns:
- Store - StoreNumber - Store name
- Number redeemed - Number of redeemed bonus checks issued in selected rollout(s)
- Sum redeemed - Sum of redeemed bonus checks
- Redeemed of total issued % - Share of redeemed bonus checks number for store compared to issued bonus checks number for all stores
- Average sale - Average sale made using bonus checks
Sorting:
- StoreNo
Clarifications:
- Check is considered redeemed even if it was only partialy used
- Check is conntected to the store in which it was redeemed, not issued
Source: Lindbak POS Reporting cube (OLAP)


Description:
Report allows to follow up article sales on multiple levels with possibility to select specific hourly intervals and exclude specific item groups.
Selections:
- Date from - Default today
- Date to - Default today
- Hour from - Default 0:00
- Hour to - Default 24:00
- Team - Default all
- Retail store - Default all
- Department - Default all
- Article area - Default all
- Article group - Default all
- Include VAT - Default on
- Exclude groups - Default false
- Excluded groups - Appears when Exclude groups is switched to true
Output:
Article sale statistics for selected stores, for selected date interval and for selected time interval grouped by department, area and group.
By default data is shown for department and it is possible to drill down to item level manually by clicng plus button or by using expand all button to expand everithing to item level at once.
Columns:
- EAN - EAN code
- Item name - Article name
- Quantity
- Total - Quantity sold
- Turnover inc. VAT or Turnover ex. VAT depending on selection.
- Total - Amount sold. Inc. or ex. VAT depending on selection
- Share - Share of this department / area / group / item related to total sale.
- Cost price
- Gross profit
- Total - Gross profit amount
- Total % - Gross profit percentage.
Sorting:
- Department number
- Item Area number
- Item Group number
- EAN
Clarifications:
- Hour selection applies to each day in selected date period
Source: Lindbak POS Reporting cube (OLAP)