Standard Report

Description:
- Report allows to follow up cashiers sale performance.
Selections:
- Date from: Default today
- Date to: Default today
- Retail store: Default first available (from list of stores ordered by store number)
- Operator: Default all
- Price channels - Default all
Output:
Item sale statistics showed individually per each cashier (with number between Operator from and Operator to) per each stores (with number between Retail store from and Retail store to).
Additionally there are totals for each cashier and each store.
Columns:
- EAN
- Item name
- Quantity
- Discount % - Share of discount amount in original prize
- Gross profit
- Gross profit % - (gross profit)/(sales ex. VAT)
- Sales amount - sales inc. VAT
Sorting:
- EAN (default)
Source:
- Lindbak POS Reporting cube (OLAP)
Standard report
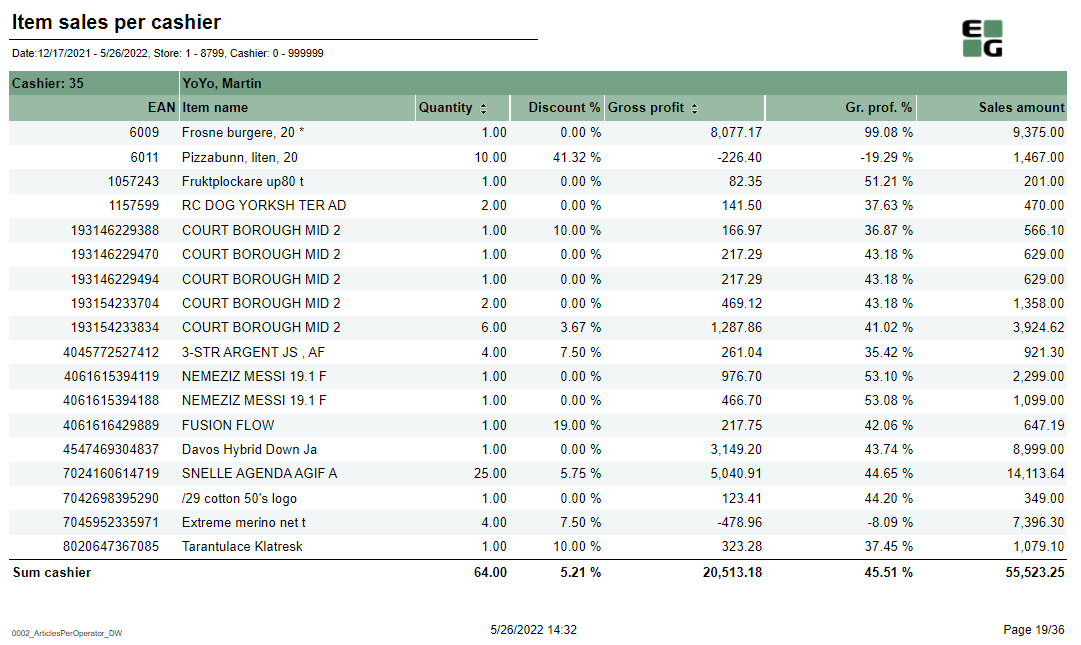
Description:
- Report allows to follow up cashiers sale performance.
Selections:
- Date from: Default today
- Date to: Default today
- Retail store from: Default first from store list
- Retail store to: Default first from store list
- Operator from: Default 0
- Operator to: Default 999999
Output:
Item sale statistics showed individually per each cashier (with number between Operator from and Operator to) per each stores (with number between Retail store from and Retail store to).
Additionally there are totals for each cashier and each store.
Columns:
- EAN
- Item name
- Quantity
- Discount % - Share of discount amount in original prize
- Gross profit
- Gross profit % - (gross profit)/(sales ex. VAT)
- Sales amount - sales inc. VAT
Sorting:
- EAN (default)
- Qunatity (interactive)
- Gross profit (interactive)
Source:
- Lindbak POS Reporting DW
Standard report


Description:
Report is devided one page per store and shows cashiers sale statistics. On the last page there is summary for all selected stores.
Selection:
- Date from: Default today
- Date to: Default today
- Retail store from: Default first from store list
- Retail store to: Default first from store list
- Operator from: Default 0
- Operator to: Default 999999
Output:
- One row per one cashier showing his/her sales performance
- On the last page: one row per store without division per cashier
Columns:
- Number: Cashier number
- Cashier name
- Number: Quantity of sold items
- Cust#: Number of receipts
- Sales amount: Sales amount inc. VAT
- Discount %: Share of discount in original price
- Gr. prof.%: Share of Gross profit in Net amount.
- Gross profit
- Price pr. Art.: (Sales amount) / (Number (of all items sold))
- Sale pr. cust.: (Sales amount) / (Cust#)
- Items pr. Cust.: (Number (of all items sold)) / (Cust#)
Sorting:
- Pages (stores) by store number
- Rows:
- Number (of items sold) - interactive
- Gross profit - interactive
Source:
- Lindbak POS Reporting cube (OLAP)
Standard report
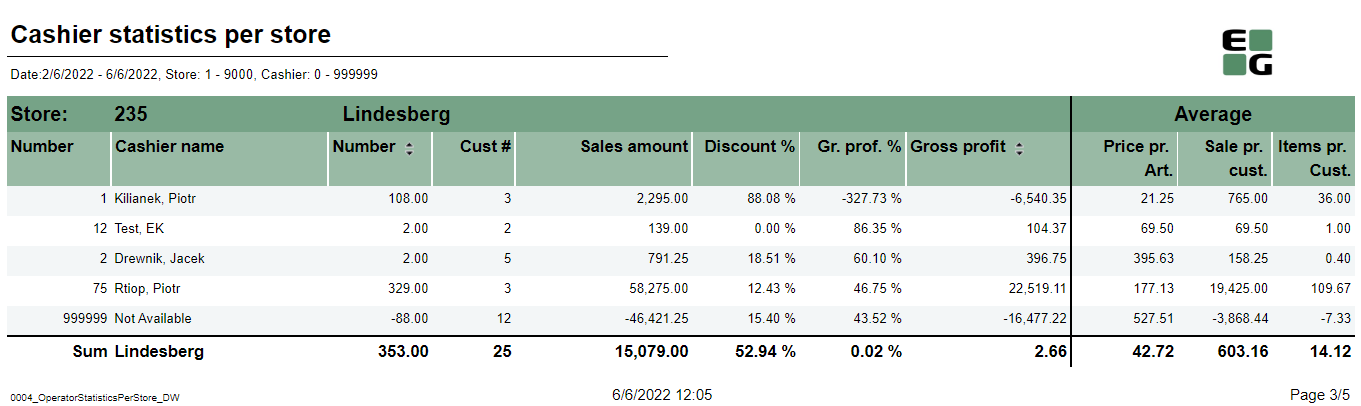
Description:
Report is devided one page per store and shows cashiers sale statistics. On the last page there is summary for all selected stores.
Selection:
- Date from: Default today
- Date to: Default today
- Retail Store: Default all, multivalue (possibility to select more than one store)
- Operator: Default all, multivalue (possibility to select more than one operator)
Output:
- One row per one cashier showing his/her sales performance
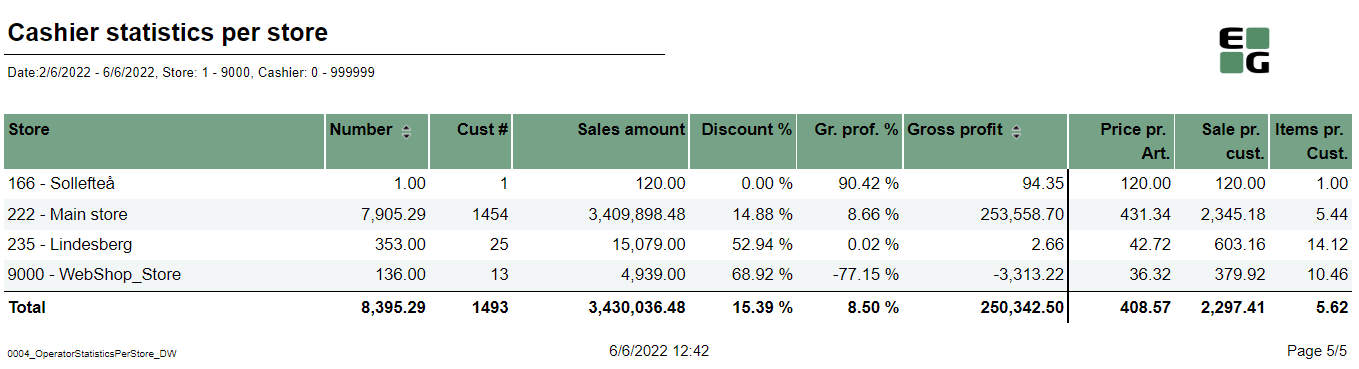
- On the last page: one row per store without division per cashier
Columns:
- Number: Cashier number
- Cashier name
- Number: Quantity of sold items
- Cust#: Number of receipts
- Sales amount: Sales amount inc. VAT
- Discount %: Share of discount in original price
- Gr. prof.%: Share of Gross profit in Net amount.
- Gross profit
- Price pr. Art.: (Sales amount) / (Number (of all items sold))
- Sale pr. cust.: (Sales amount) / (Cust#)
- Items pr. Cust.: (Number (of all items sold)) / (Cust#)
Sorting:
- Pages (stores) by store number
- Rows:
- Number (of items sold) - interactive
- Gross profit - interactive
Source:
- Lindbak POS Reporting DW
Standard report
Description:
Report allows to follow up sales statistics per cashier and per vendor (supplier). Report is devided sections per each selected cashier. Each section shows sales statistics per vendor.
Selection:
- Date from: Default today
- Date to: Default today
- Retail store: Default firts from store list
- Operator: Default all
Output:
- One section per each cashier showing sales statistics divided per each vendor (supplier) with not null sale amount.
Columns:
- Vendor number
- Vendor name
- Items: Quantity of sold items
- Discount %: Share of discount in original price
- Gross profit
- Gr. prof.%: Share of Gross profit in Net amount.
- Sales amount: Sales amount inc. VAT
Source:
- Lindbak POS Reporting cube (OLAP)
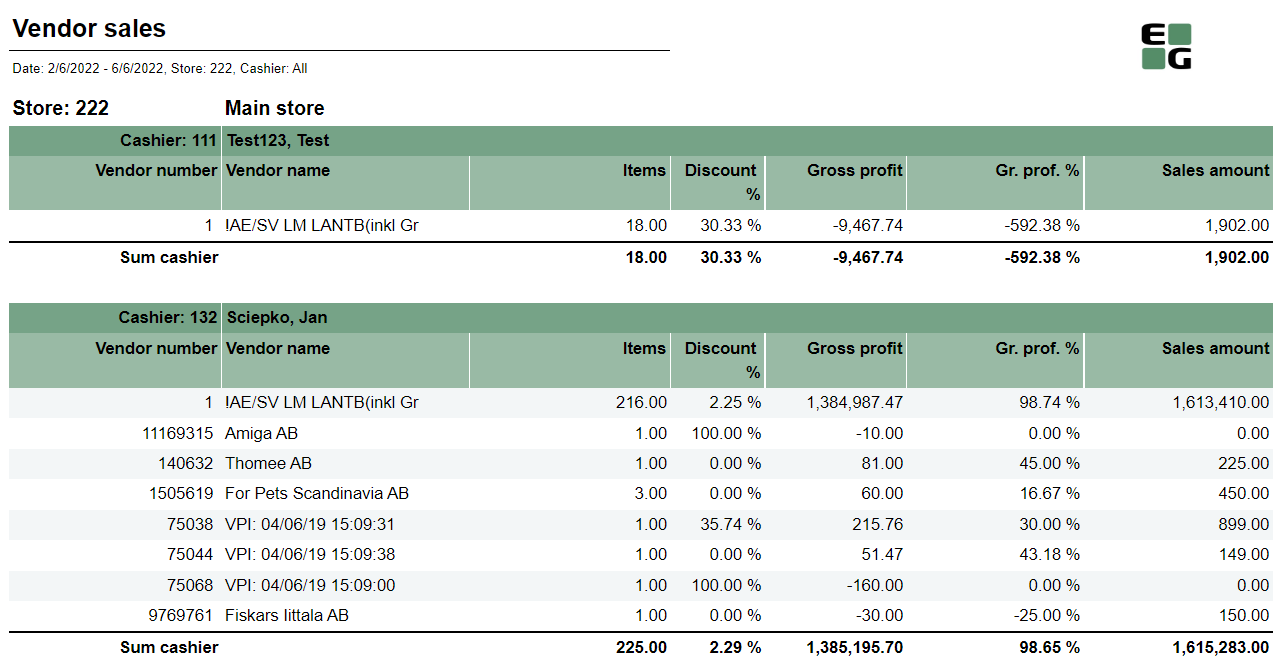
Standard report
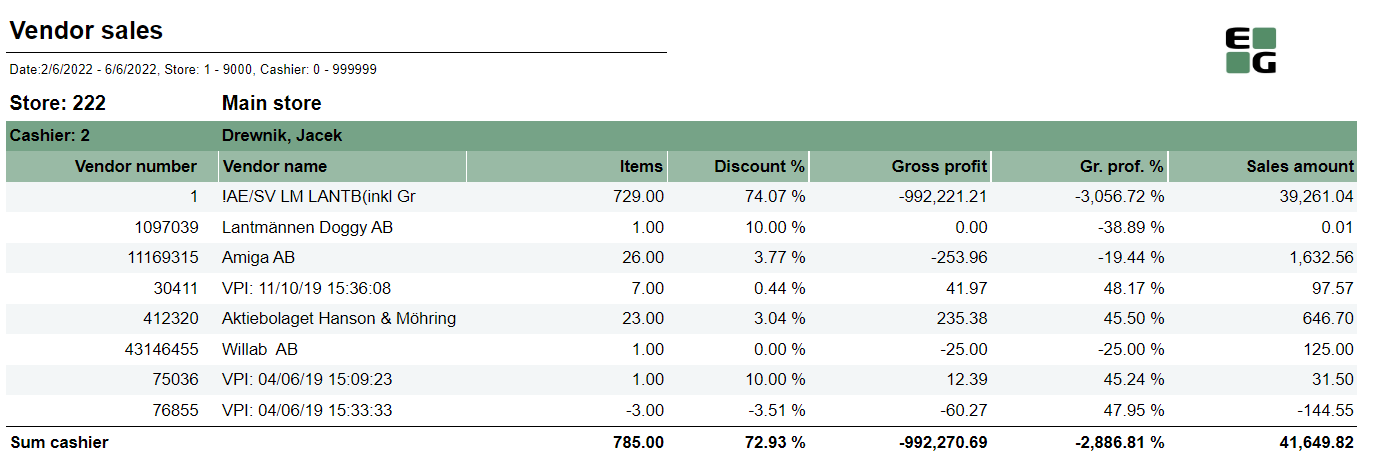
Description:
Report allows to follow up sales statistics per cashier and per vendor (supplier). Report is devided sections per each selected cashier. Each section shows sales statistics per vendor.
Selection:
- Date from: Default today
- Date to: Default today
- Retail store from: Default first from store list
- Retail store to: Default first from store list
- Operator from: Default 0
- Operator to: Default 999999
Output:
- One page per store. One section per each cashier showing sales statistics divided per each vendor (supplier) with not null sale amount.
Columns:
- Vendor number
- Vendor name
- Items: Quantity of sold items
- Discount %: Share of discount in original price
- Gross profit
- Gr. prof.%: Share of Gross profit in Net amount.
- Sales amount: Sales amount inc. VAT
Source:
- Lindbak POS Reporting DW
Standatd report
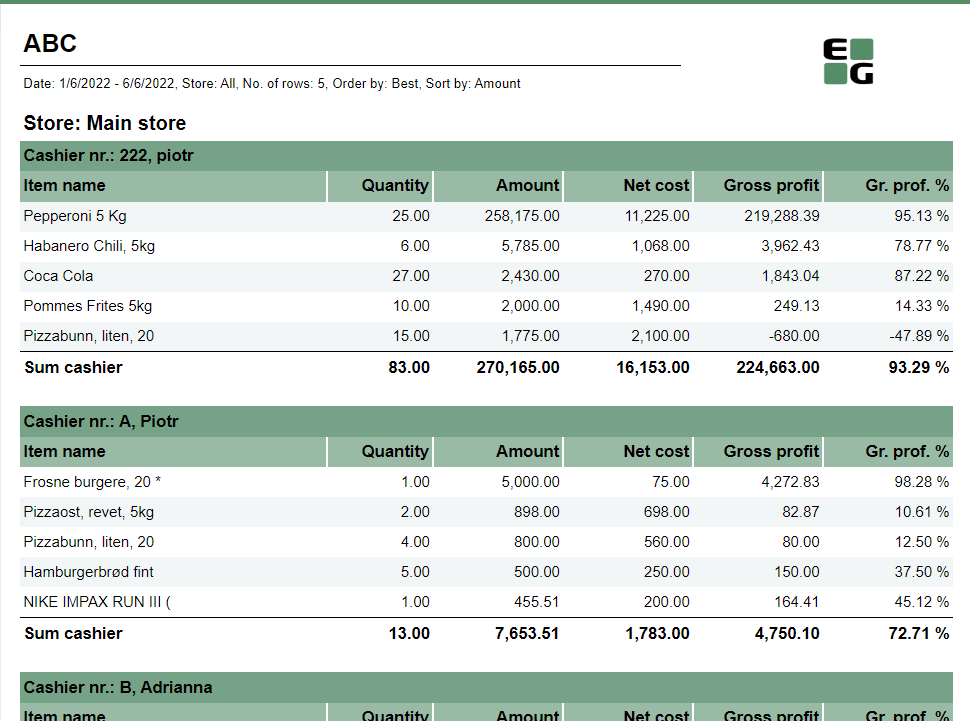
Description:
Report allows to find given number of best or worst selling items per store, per cashier on multiple levels (amount, quantity, net cost, gross profit).
Selections:
- Date from: Default today
- Date to: Default today
- Retail store: Default all
- Number of items: Number of best or worst items to display - default 5
- Sort type: worst or best - report will display given number of worst or best selling items - default best
- Sort measure: amount/quantity/net cost/gross profit/gross profit % - set the measure on which the items are sorted. - default amount
- Article group: Default all
Output:
One page per each store. One section per each cashier. Inside the section selected number of best (or worst) selling items for given cashier.
Columns:
- Qunatity
- Amount: Sales amount inc. VAT
- Net Cost
- Gross profit
- Gr. profit %: Share of Gross profit in Net amount
Sorting:
- Selected sort measure
Source:
- Lindbak POS Reporting cube (OLAP)
Standard report

Description:
Report allows to find given number of best or worst selling items on multiple levels (amount, quantity, gross profit, etc.) per selected hierarchy level (department,item area, etc.)
Selections:
- Date from: Default today
- Date to: Default today
- Store: Possible to select one store or all available; default all
- Profile: Multivalue; default all
- Department: Multivalue; default all
- Article area: Multivalue; default all
- Article group: Multivalue; default all
- Article subgroup: Multivalue; default all
- Article identifier: Possible to select Item ID or Model. Only name of column is changed - field is always Item ID
- Grouping: Selection of hierarchy level for which number of best items will be displayed. Possible selections: Department, Article area, Article group, Article sub group, Store; default Area.
- Count: Number of best or worst items to display - default 10
- Sort type - worst or best - report will display given number of worst or best selling items - default best
- Sort measure - amount/quantity/net cost/gross profit/gross profit % - set the measure on which the items are sorted. - default amount
Output:
Sale statistics for selected number of best or worst items per selected grouping (store or hierarchy level) sorted by selected sort measure with totals on higher levels (e.g. for grouping: article area there are totals for department and store, but for grouping: depratment there will be only total per store)
Columns:
- Dept.: Department number
- Area: Item area number
- Grp.: Item group number
- Srg.: Subgroup number
- EAN
- Model/ItemID: Article identifier (ItemID - see clarifications)
- Item name
- Quantity
- Amount: Sales amount inc. VAT
- Net cost
- Gross profit
- Gr. prof. %: Share of Gross profit in Net amount
Sorting:
- Selected sort measure
Clarifications:
- Article identifier: Possible to select Item ID or Model. Only name of column is changed - field is always Item ID
- Totals for given level are always placed in the end of list of items belonging to given level.
Source:
- Lindbak POS Reporting cube (OLAP)
- Lindbak POS Reporting DW
Standard report

Description:
Report allows to comapare sales between two selected stores.
Selections:
- Date from: Default today
- Date to: Default today
- Retail store ref: Reference store; default first from store list
- Retail store comp: Store to compare; default first from store list
- Statistics: Expands drill down to selected level; possible selections:
- Item: expands to area level
- Model: (as in print screen, expands to lowest level - item). It also changes column No from EAN to ModelKey
- Group: expands to group level
- Area: expands to area level
- Department: expands to department level
- Department: Default all
- Article area: Default all
- Article group: Default all
- Article subgroup: Default all
Output:
Sales statistics per all item ierarchy levels (department, area, group, subgroup, item) expanded as selected in Statiscitcs parameter.
Report is devoded in 3 sections:
- per 1. store
- per 2. store
- difference between selected stores
Columns:
- No: EAN (or Model key if Model was selected for Statistics parameter)
- Name: Article name (or Model name if Model was selected for Statistics parameter)
- Cost: blank (should be Net cost)
- Sales amount: Sales amount inc. VAT
- Gr. prof.: Gross profit
- Gr. prof %: Share of Gross profit in Net Amount
Sorting:
- No sorting
Clarifications:
- In difference section columns are caltulated as simple subtruction on columns from store 1 minus store 2
Source:
- Lindbak POS Reporting cube (OLAP)
Standard report

Description:
Report gives detailed sales statistics with campaign sales statistics included.
Selections:
- Date from: Default today
- Date to: Default today
- Retail store: Multivalue; default all
- Profile: Multivalue; default all
- Department: Multivalue; default all
- Article area: Multivalue; default all
- Article group: Multivalue; default all
- Article subgroup: Multivalue; default all
- Article identifier: Possible to select Item ID or Model (ModelKey).
- Price channels: Multivalue; default all
Output:
Sale statistics for all items with not null sale amount narrowed down only by selections. One row per item.
Totals in the begining of new hierarchy level for:
- Store
- Department
- Item area
- Item group
- Subgroup
Columns:
- EAN
- Model/ItemID: Article identifier (Item ID or ModelKey)
- Item name: Item name (will change to Article Long Name if pUseLongItemText was switched true)
- Quantity sold Total
- Quantity sold Campaign: Sold item quantity in campaigns with discount keys: CampaignPrice, Group, MemberPrice
- Turnover with tax Total
- Turnover with tax Share: Share of sales amount inc. VAT for given item (group, area, ...) in all sales for given store.
- Campaign sale Total: Sale amount inc. VAT for campaigns with discount keys: CampaignPrice, Group, MemberPrice
- Campaign sale %: on item level it is share of campain sales for given item in all sales for the item (Campaign sale / Turnover with tax Total). On totals level: sum of Campaign sale % from item level which doesn't sum up to 100%
- Gross profit Total
- Gross profit Total %: Share of Gross profit in Net Amount
- Gross profit % exc. campaign: Share of gross profit for all sales except campaigns in Net amount for all sales except campaigns
- Gross profit Campaign: Gross profit for Campaign sale Total
- Gross profit Campaign %: Gross profit Campaign/ Net Amount for campaign sales
Sorting:
- No sorting
Hidden parameters:
- pAllowedPriceChannelsKeys: Default all. If changed it will narrow down possible Price channel selection
- pUseLongItemText: Default false. If set to true Item name will be changed to Article Long Name
Source:
- Lindbak POS Reporting cube (OLAP)
Standard report

Description:
Report gives detailed sales statistics with campaign sales statistics included with easier access to needed information than 0012.
Selections:
- Date from: Default today
- Date to: Default today
- Retail store: Multivalue; default all
- Profile: Multivalue; default all
- Department: Multivalue; default all
- Article area: Multivalue; default all
- Article group: Multivalue; default all
- Article subgroup: Multivalue; default all
- Article identifier: Possible to select Item ID or Model (ModelKey).
- Subvendor: Multivalue; default all
- Vendor: Multivalue; default all
- EAN list: Allows to add specific items ignoring other selections; default blank
 Expand to: Expands drill down to selected level; default Area
- Include Nonsale: If Include Nonsale was box checked, nonsale data will be included to statistics.
- Price channels: Multivalue; default all
Output:
Sale statistics for all items with not null sale (or sale + nonsale if include nonsale box checked) amount narrowed down only by selections. One row per item.
Totals in the begining of new hierarchy level for:
- Store
- Department
- Item area
- Item group: if you clicked on item group you would be moved to report 0014_SalesStatisticsPrArticles_std with saved selections and you will be able to see sales statistics for items in given item group.
- Subgroup
Columns:
- EAN
- Model/ItemID: Article identifier (Item ID or ModelKey)
- Item name: Item name (will change to Article Long Name if pUseLongItemText was switched true)
- Quantity sold Total
- Quantity sold Campaign: Sold item quantity in campaigns with discount keys: CampaignPrice, Group, MemberPrice
- Turnover with tax Total
- Turnover with tax Share: Share of sales amount inc. VAT for given item (group, area, ...) in all sales for given store.
- Campaign sale Total: Sale amount inc. VAT for campaigns with discount keys: CampaignPrice, Group, MemberPrice
- Campaign sale %: Share of campain sales for given item in all sales for the item (Campaign sale / Turnover with tax Total)
- Gross profit Total
- Gross profit Total %: Share of Gross profit in Net Amount
- Gross profit % exc. campaign: Share of gross profit for all sales except campaigns in Net amount for all sales except campaigns
- Gross profit Campaign: Gross profit for Campaign sale Total
- Gross profit Campaign %: Gross profit Campaign/ Net Amount for campaign sales
Sorting:
- No sorting
Hidden parameters:
- pAllowedPriceChannelsKeys: Default all. If changed it will narrow down possible Price channel selection
Source:
- Lindbak POS Reporting cube (OLAP)
Standard report

Description:
Report gives detailed sales statistics with campaign sales statistics per article with grouping only per store.
Selections:
- Date from: Default today
- Date to: Default today
- Retail store: Multivalue; default all
- Profile: Multivalue; default all
- Department: Multivalue; default all
- Article area: Multivalue; default all
- Article group: Multivalue; default all
- Article subgroup: Multivalue; default all
- Article identifier: Possible to select Item ID or Model (ModelKey).
Output:
Sale statistics for all items with not null sale amount narrowed down only by selections. One row per item. One page per store.
Columns:
- EAN
- Model/ItemID: Article identifier (Item ID or ModelKey)
- Item name: Item name (will change to Article Long Name if pUseLongItemText was switched true)
- Quantity sold Total
- Quantity sold Campaign: Sold item quantity in campaigns with discount keys: CampaignPrice, Group, MemberPrice
- Turnover with tax Total
- Turnover with tax Share: Share of sales amount inc. VAT for given item (group, area, ...) in all sales for given store.
- Campaign sale Total: Sale amount inc. VAT for campaigns with discount keys: CampaignPrice, Group, MemberPrice
- Campaign sale %: Share of campain sales for given item in all sales for the item (Campaign sale / Turnover with tax Total)
- Gross profit Total
- Gross profit Total %: Share of Gross profit in Net Amount
- Gross profit % exc. campaign: Share of gross profit for all sales except campaigns in Net amount for all sales except campaigns
- Gross profit Campaign: Gross profit for Campaign sale Total
- Gross profit Campaign %: Gross profit Campaign/ Net Amount for campaign sales
Sorting:
- No sorting
Source:
- Lindbak POS Reporting cube (OLAP)
Standard report
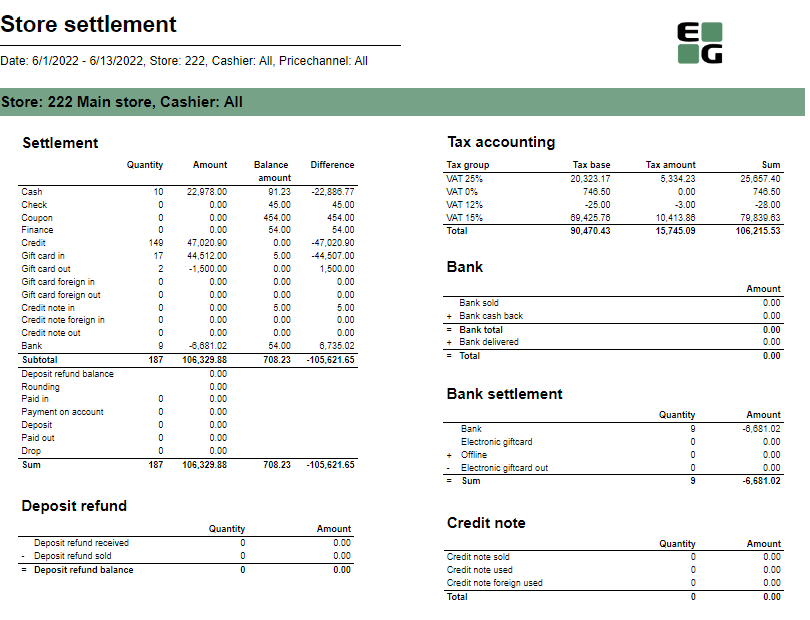
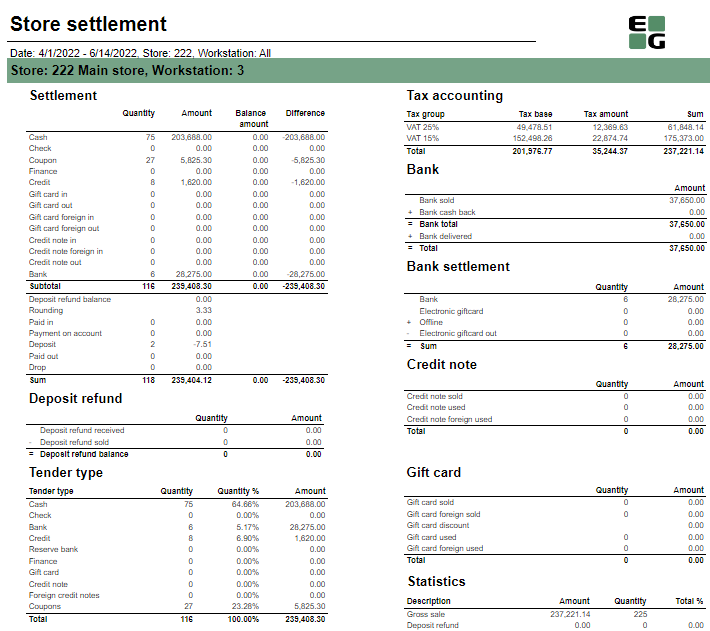
Description:
Report allows to follow up store settlement: on first page settlement for all selected cashiers (if all cashiers are selected it equals whole store settlement) and settlement per each cashier on following pages. Report is divided in 12 subreports which will be descriped separatly below.
Selections (applies to all subreports):
- Date from: Default today
- Date to: Default today
- Store: Single value; default first available from the list.
- Operator: Multivalue; default all
- Price channels: Multivalue; default all
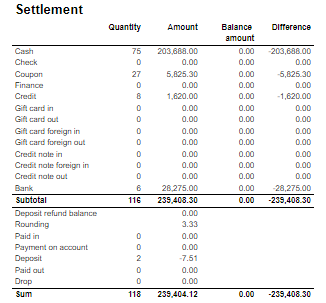
Subreports:
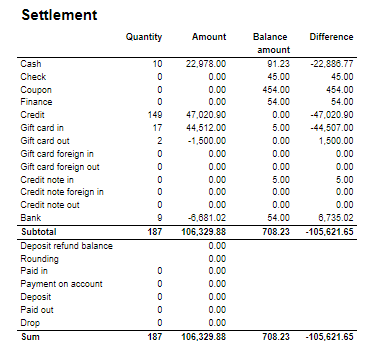
Columns:
- Quantity
- Amount
- Balance amount
- Difference: Balance amount - Amount
Rows:
One row per tender type . In means received, out means given (returns etc...)
- Cash: Tender type key = Cash or CashBack
- Check
- Coupon
- Finance
- Credit
- Gift card in
- Gift card out
- Gift card foreign in
- Gift card foreign out
- Credit note in
- Credit note foreign in
- Credit note out
- Bank: Tender Type Key = CreditDebit or CreditDebitOffline or ECreditDebit
- Subtotal: Total for all rows above Subtotal
______________________________________________________________________________________
- Deposit refound balance: Tender type key DepositRefund received - DepositRefund given
- Rounding: Subtotal rounding
- Paid in: Tender Control Type Key: PayedIn
- Payment on account: Tender Control Type Key: PaymentOnAccount
- Deposit: Article Type Key: Deposit
- Paid out: Tender Control Type Key: PayedOut
- Drop: Tender Control Type Key: Drop
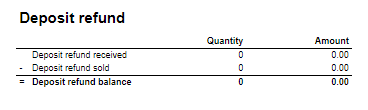
Columns:
- Amount: Sales amount inc. VAT
- Qunatity: Number of receipts.
Rows:
- Deposit refund received: Amount (or number of receipts) for direction in for Article Type Key: DepositRefund
- Deposit refund sold: Amount (or number of receipts) for direcion out for Article Type Key: DepositRefund
- Deposit refund balance: Received - sold
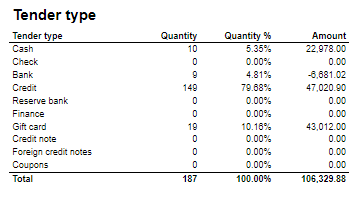
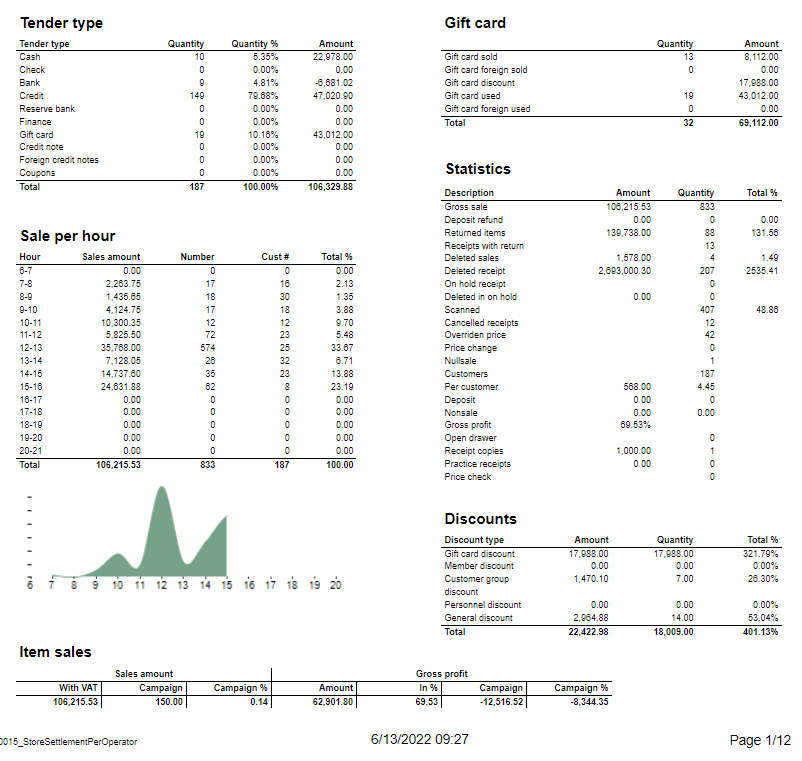
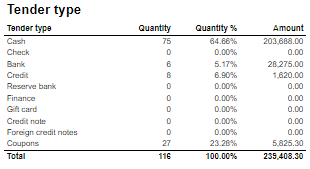
Columns:
- Qunatity
- Qunatity %: Share of given tender type quantity in whole quantity
- Amount: Sales inc. VAT per tender type
Rows:
- One row per one tender type
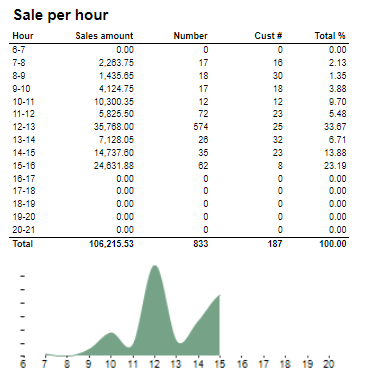
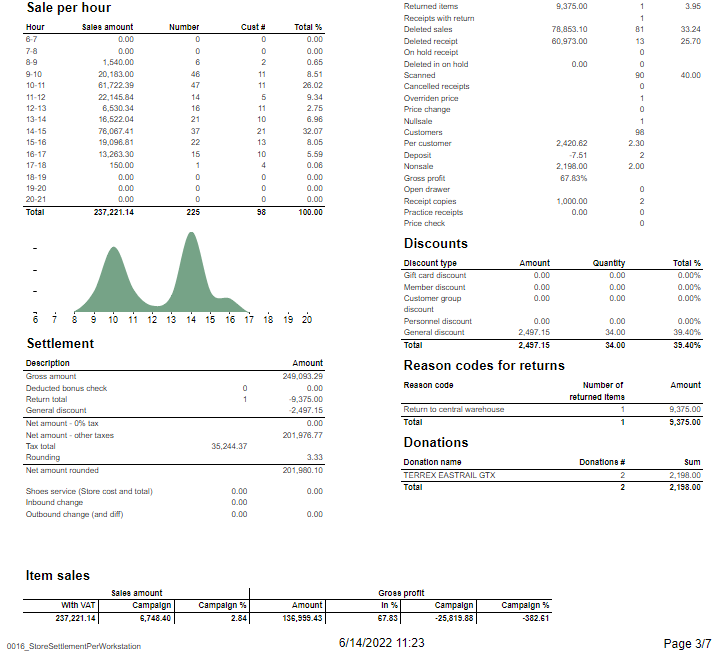
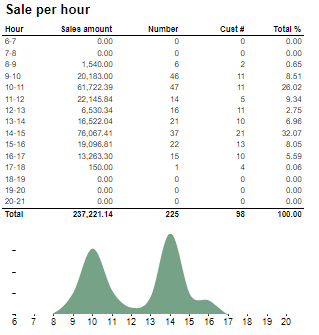
Description:
Sales statistics hour by hour with graph showing sales Amount.
Columns:
- Hour
- Sales amount: sales inc. VAT
- Number: sold quantity
- Cust #: number of receipts
- Total %: Share of sales amount per hour in whole sales amount
Rows:
- one row per hour with total in the end
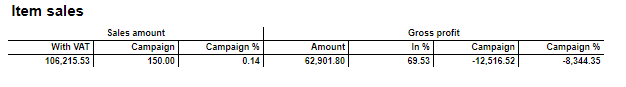
Columns:
- Sales amount With VAT:
- Sales amount Campaign: Sale amount inc. VAT for campaigns with discount keys: CampaignPrice, Group, MemberPrice
- Sales amount campaign %: Share of campain sales in all sales (Sales amount Campaign / Sales amount With VAT)
- Gross profit Amount
- Gross profit In %: Share of Gross profit in Net Amount
- Gross profit Campaign: Gross profit for Campaign
- Gross profit Campaign %: Share of gross profit for campains in campaign sales (Gross profit Campaign/ Sales amount Campaign)
Rows:
- One row for totals
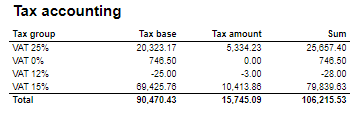
Columns:
- Tax group: tax type
- Tax base: Net amount
- Tax amount: tax
- Sum: Turnover inc. VAT
Rows:
- One row per one tax type
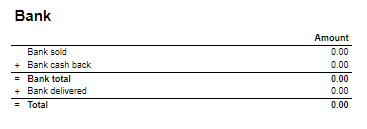
Rows:
- Bank sold: Sales amount for tender types: CreditDebit, CreditDebitOffline, ECreditDebit
- Bank cash back: tender type Cash back
- Bank delivered: tender type: DeliveredBalance
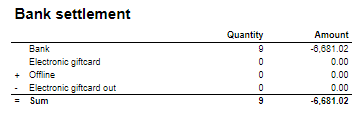
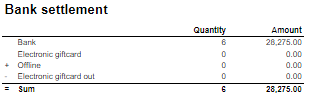
Rows:
- Bank: Amount for tender types: CreditDebit, CreditDebitOffline, ECreditDebit, Cash back
- Electronic giftcard: Amount for few hard coded payment card keys
- Offline: Amount for CreditDebitOffline
- Electronic giftcard out: Outcoming amount for few hard coded payment card keys
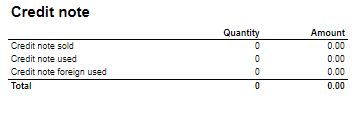
Rows:
- Credit note sold: Quantity/ Amount of sold by store credit notes
- Credit note used: Credit notes used in the store
- Credit note foreign used: Foreign credit notes used in the store
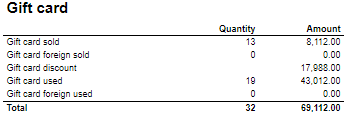
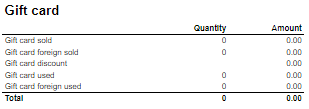
Columns:
- Quantity: number of gift cards
- Amount: Amount on gift cards
Rows:
- Gift Card sold: Gift cards sold by given operator in given store
- Gift card foreign sold: Foreign gift cards sold by given operator in given store
- Gift card discount:
- Gift card used: Sales amount inc. VAT made with gift cards. (Number of transactions made with gift cards)
- Gift card foreign used: Sales amount inc. VAT made with foreign gift cards. (Number of transactions made with foreign gift cards)

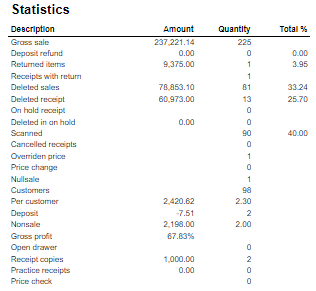
Rows:
- Gross sale amount: Amount inc. VAT
Total%:
- Deposit refund: Deposit refound amount / Gross sale amount
- Returned items: Returned items amount/ Gross sale amount
- Deleted sales: Deleted amount/ Gross sale amount
- Deleted reciept: Deleted receipts amount/ Gross sale amount
- Scanned: Scanned quantity/ Gross sale qunatity
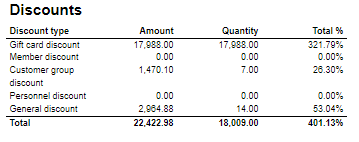
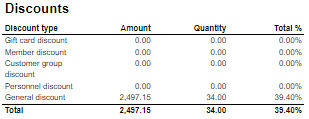
Columns:
- Amount: Discount amount
- Quantity: quantity of items sold with given discount
- Total %: Share of given discount amount in all discounts amount
Rows:
- One row per one type of discount
Source:
- Lindbak POS Reporting cube (OLAP)
Description:
Report allows to follow up store settlement: on first page settlement for all selected workstations (if all cashiers are selected it equals whole store settlement) and settlement per each workstation on following pages. Report is divided in 15 subreports which will be descriped separatly below.
Selections (applies to all subreports):
- Date from: Default today
- Date to: Default today
- Store: Single value; default first available from the list.
- Workstation: Multivalue; default all
Subreports:
Columns:
- Quantity
- Amount
- Balance amount
- Difference: Balance amount - Amount
Rows:
One row per tender type . In means received, out means given (returns etc...)
- Cash: Tender type key = Cash or CashBack
- Check
- Coupon
- Finance
- Credit
- Gift card in
- Gift card out
- Gift card foreign in
- Gift card foreign out
- Credit note in
- Credit note foreign in
- Credit note out
- Bank: Tender Type Key = CreditDebit or CreditDebitOffline or ECreditDebit
- Subtotal: Total for all rows above Subtotal
______________________________________________________________________________________
- Deposit refound balance: Tender type key DepositRefund received - DepositRefund given
- Rounding: Subtotal rounding
- Paid in: Tender Control Type Key: PayedIn
- Payment on account: Tender Control Type Key: PaymentOnAccount
- Deposit: Article Type Key: Deposit
- Paid out: Tender Control Type Key: PayedOut
- Drop: Tender Control Type Key: Drop
Columns:
- Amount: Sales amount inc. VAT
- Qunatity: Number of receipts.
Rows:
- Deposit refund received: Amount (or number of receipts) for direction in for Article Type Key: DepositRefund
- Deposit refund sold: Amount (or number of receipts) for direcion out for Article Type Key: DepositRefund
- Deposit refund balance: Received - sold
Columns:
- Qunatity
- Qunatity %: Share of given tender type quantity in whole quantity
- Amount: Sales inc. VAT per tender type
Rows:
- One row per one tender type
Description:
Sales statistics hour by hour with graph showing sales Amount.
Columns:
- Hour
- Sales amount: sales inc. VAT
- Number: sold quantity
- Cust #: number of receipts
- Total %: Share of sales amount per hour in whole sales amount
Rows:
- one row per hour with total in the end
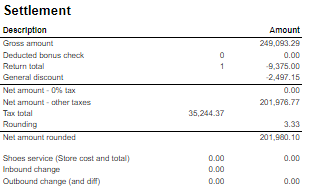
Rows:
- Gross amount: Amount inc. VAT + General discount - Returns
- Deducted bonus check: Return amount on article group set in hidden parameter: pBonusCheckArticleGroup
- Return total: All rerutns amount - Deducted bonus check
- General discount: Discount amount with keys: Line and Subtotal
__________________________________________________________________________________
- Net amount - 0% tax: Net amount with 0% tax
- Net amount - other taxes: Net amount
- Tax total: tax amount
- Rounding: Subtotal rounding amount
__________________________________________________________________________________
- Net amount rounded: both Net amounts + Rounding
- Shoes serviece (Store cost and total): balance amount with tender type: InboundChangeBalance; Sales inc. VAT per article with article type: Service
- Inbound change: Return amount per article with article type: Service
- Outbound change: Remaining Amoun tIn Drawer; difference: Remaining Amoun tIn Drawer - balance amount with tender type: InboundChangeBalance
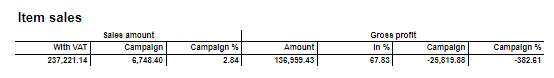
Columns:
- Sales amount With VAT:
- Sales amount Campaign: Sale amount inc. VAT for campaigns with discount keys: CampaignPrice, Group, MemberPrice
- Sales amount campaign %: Share of campain sales in all sales (Sales amount Campaign / Sales amount With VAT)
- Gross profit Amount
- Gross profit In %: Share of Gross profit in Net Amount
- Gross profit Campaign: Gross profit for Campaign
- Gross profit Campaign %: Share of gross profit for campains in campaign sales (Gross profit Campaign/ Sales amount Campaign)
Rows:
- One row for totals
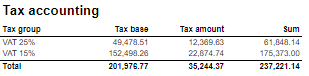
Columns:
- Tax group: tax type
- Tax base: Net amount
- Tax amount: tax
- Sum: Turnover inc. VAT
Rows:
- One row per one tax type
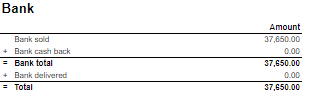
Rows:
- Bank sold: Sales amount for tender types: CreditDebit, CreditDebitOffline, ECreditDebit
- Bank cash back: tender type Cash back
- Bank delivered: tender type: DeliveredBalance
Rows:
- Bank: Amount for tender types: CreditDebit, CreditDebitOffline, ECreditDebit, Cash back
- Electronic giftcard: Amount for few hard coded payment card keys
- Offline: Amount for CreditDebitOffline
- Electronic giftcard out: Outcoming amount for few hard coded payment card keys
Rows:
- Credit note sold: Quantity/ Amount of sold by store credit notes
- Credit note used: Credit notes used in the store
- Credit note foreign used: Foreign credit notes used in the store
Columns:
- Quantity: number of gift cards
- Amount: Amount on gift cards
Rows:
- Gift Card sold: Gift cards sold by given operator in given store
- Gift card foreign sold: Foreign gift cards sold by given operator in given store
- Gift card discount
- Gift card used: Sales amount inc. VAT made with gift cards. (Number of transactions made with gift cards)
- Gift card foreign used: Sales amount inc. VAT made with foreign gift cards. (Number of transactions made with foreign gift cards)
Rows:
- Gross sale amount: Amount inc. VAT
Total%:
- Deposit refund: Deposit refound amount / Gross sale amount
- Returned items: Returned items amount/ Gross sale amount
- Deleted sales: Deleted amount/ Gross sale amount
- Deleted reciept: Deleted receipts amount/ Gross sale amount
- Scanned: Scanned quantity/ Gross sale qunatity
Columns:
- Amount: Discount amount
- Quantity: quantity of items sold with given discount
- Total %: Share of given discount amount in all discounts amount
Rows:
- One row per one type of discount
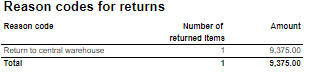
Description:
Amount inc. VAT and quantity of items returned. One row per reason code.
Description:
Nonsale Amount and number of transactions per article.
Clarification:
Articles to displayed can be narrowed down by changing parameter: pArticlesSet
Source:
- Lindbak POS Reporting cube (OLAP)
Standard report

Description:
Report lists sales per hour bar chart.
Selections:
- Date – Default today
- Stores – Default all
Relevant parameters:
pHourFrom and pHourTo – use to set hours on x axis of bar chart.
Output:
X axis represents hours from 8 to 18. Y axis is sales amount.
Columns (bars):
- Current day – Selected Date
- Last week - Default the same day of week as Date week before
- Last month - Default the same day of week as Date month before
- Last year - Default the same day of week as Date year before
Source:
- Lindbak POS Reporting Cube (OLAP)
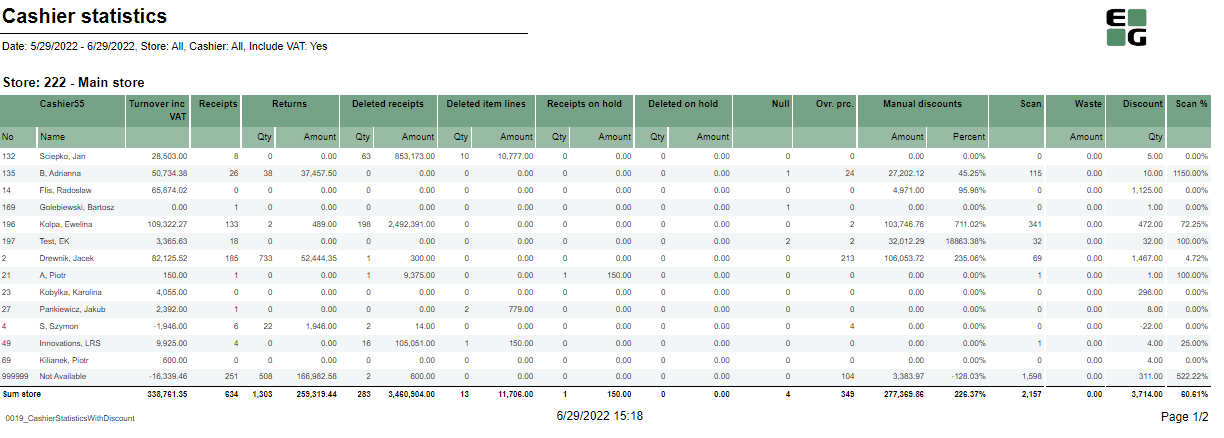
Standart report

Description:
- Report allows to follow up Cashiers sales and selected activities.
Selections:
- Date from: Default today
- Date to: Default today
- Retail store: Default all
- Operator: Default all
- Include VAT: Allows to decide if Vat is included in sales amount or not; default yes.
Output:
One page per store
One row per cashier
Columns:
- No: Operator number
- Name: Operator name
- Turnover inc VAT/ Turnover ex VAT
- Receipts: number of reciepts
- Returns
- Deleted receipts
- Deleted item lines
- Receipts on hold
- Deleted on hold
- Null: Number of drawer opening without any transaction
- Ovr. prc.: Overriden price count
- Scan: Number of scanned articles
- Waste: Breakage amount
- Discount: Discount quantity
- Scan %: Scan divided by Quantity of sold items
Sorting:
- No sorting
Source:
- Lindbak POS Reporting cube (OLAP)
Description:
- Report allows to follow up Cashiers sales and selected activities.
Selections:
- Date from: Default today
- Date to: Default today
- Retail store: Default all
- Operator: Default all
- Include VAT: Allows to decide if Vat is included in sales amount or not; default yes.
Output:
One page per store
One row per cashier
Columns:
- No: Operator number
- Name: Operator name
- Turnover inc VAT/ Turnover ex VAT
- Receipts: number of reciepts
- Returns
- Deleted receipts
- Deleted item lines
- Receipts on hold
- Deleted on hold
- Null: Number of drawer opening without any transaction
- Ovr. prc.: Overriden price count
- Manual Discount Amount
- Manual Discoun percent.: Discount Amount divided by Original amount
- Scan: Number of scanned articles
- Waste: Breakage amount
- Discount: Discount quantity
- Scan %: Scan divided by Quantity of sold items
Sorting:
- No sorting
Source:
- Lindbak POS Reporting cube (OLAP)

Description:
Report lists each cashier sales in stores.
Selections:
- Date from -Default today
- Date to -Default today
- Article EAN – Default all
- Store – default all
Output:
- Report table has a summary for each column. One page per store.
- Each report table has a 3d round bar graph with total sales and gross profit. X axis is cashier name, y axis is amount of total sales and gross profit.
Columns:
- Seller name – Cashier name
- Seller nr – Cashier number
- Total Sales
- Quantity
- Customers – Number of customers
- ATV – Average transactions value
- UPT – Units per transaction
- Gr. prof. % - Gross profit percentage
- Makeup % - Makeup Article group sales percentage
- Skincare % - Skincare article group sales percentage
Interactive sorting:
Interactive sorting on all except Makeup % and Skincare %.
Source:
- Lindbak POS Reporting Cube (OLAP)

Description:
Report lists items, their quantity and amount for selected, specific values.
Selections:
- Date from – Default today
- Date to – Default today
- Store – Default all
- Group – Default all
- Sort – Default: Best
- Accumulation – Default: Total + Store
- Measure – Default: Amount
- Count – Default set 10
Output:
Report shows bestsellers or worst sold items and their quantity and sum amount for selected store (one store per site) and period time.
Columns:
- No – Item id
- Name – Article name
- Quantity
- Sum - Amount
- Gross profit
- Gr. prof. % - Gross profit percentage
Clarifications:
Report can show counted number of products, Accumulation and can be measured by amount, quantity or gross profit.
Source:
- Lindbak POS Reporting Cube (OLAP)

Description:
Report lists package sales.
Selections:
- Date from – Default today
- Date to – Default today
- Store – Default all
Output:
Packages grouped per store. One row per package. Report has a summary for each column (all stores and packages).
Columns:
- Buttons for expanding and collapsing all drilldowns
- Package num. – Package number
- Package name
- Quantity
- Cost – Cost package
- Unit price Amount package price
- Turnover
- VAT – VAT amount
- Gr. prof. – Gross profit
- Gr. prof. % - Gross profit percentage
- % of total – Percentage of total sales of packages
Interactive sorting:
Everything except Cost, unit price and % of total
Source:
- Lindbak POS Reporting Cube (OLAP)

Description:
Report lists sales per cashier in stores.
Selections:
- Date from – Default today
- Date to – Defaul today
- Store – Default all
- Article EAN – Default all
- Item list – Default all
Output:
- Report shows sales all cashiers in selected stores. Report table has a summary on each column. There is one page per store.
- Report has a bar chart for each table. X axis is total sales and gross profit bars for each cashier, and y axis is sales and gorss profit amount.
Columns:
- Seller name – Cashier name
- Seller nr – Cashier number
- Total Sales
- Quantity
- Customers – Number of customers
- ATV – Average transactions value
- UPT – Units per transaction
- Gr. prof. % - Gross profit percentage
- Makeup % - Makeup Article group sales percentage
- Item List % - Item list sales percentage
- Gifts % - Gift sales percentage
Interactive sorting:
Interactive sorting on all columns excepts Makeup %, Item list % and Gifts %
Source:
- Lindbak POS Reporting Cube (OLAP)

Description:
Report lists cashiers from stores and their sales.
Selections:
- Date from – Default today
- Date to – Default today
- Store – Default all
- Item list- Default all
- Article group – Default all
- Article EAN – Default all
Output:
- Reports lists all cashiers fom selected stores and their sales for customers for selected period of time, item list and article group.
- Report has a total summary at the end of list for each column.
Columns:
- Seller name – Cashier name
- Seller nr – Cashier number
- Total Sales -Total Amount
- Customer – Number of receipts
- ATV – Average transaction value
- UPT – Units per transaction
- Gr. prof. % - Gross profit percentage
- Makeup % - Article group sales percentage
- Item List % Gifts % - Gift sales percentage
- Item group sales
Interactive sorting:
Everything except Makeup %, Item list%, Gifts % and Item group sales
Source:
Lindbak POS Reporting Cube (OLAP)

Description:
Report lists besteller items in stores.
Selections:
- Date from – Default today
- Date to – Default today
- Count – Default 10
- Store – Default all
- Area – Default all
- Group – Default all
- Subgroup – Default all
- Measure – Default Amount
Output:
Report lists selected number of bestellers items including their quantity and amount in selected stores and period of time.
Columns:
- Item num. – Item number
- EAN
- Item name
- Quantity
- Amount
- Gross profit
- Gross profit %
Source:
Lindbak POS Reporting Cube (OLAP)

Description:
Report lists staff discount for employees.
Selections:
- Date from – Default today
- Date to – Default today
- Stores – Default all
Output:
Summary totals in the beginning of new hierarchy level for Employees. Summary in the beginning of table for each column for all Employees.
Columns:
- Buttons for expanding and collapsing all drilldowns.
- Employee – Employee number and name
- Date
- Item num. – Item number
- Item name
- Quantity
- Discounts – Employee discounts
- Discount % - Employee discount percentage
- Sales amount GP % - Gross profit %
Interactive sorting:
Interactive sorting on all columns except Date, Item num. and Item name.
Source:
- Lindbak POS Reporting Cube (OLAP)

Description:
Report lists type of discounts in stores
Selections:
- Date from – Default today
- Date to – Default today
- Store – Default all
- Discounts – Default all
Output:
Summary totals at the end of new hierarchy level for stores.
Columns:
- Buttons for expanding and collapsing all drilldowns.
- Store num. – Store number
- Store – Store name Discount type
- Quantity
- Discounts
- Discount % GP % - Gross profit percentage
Interactive sorting:
Interactive sorting on Store num. and Store columns
Source:
- Lindbak POS Reporting Cube (OLAP)

Description:
Report lists discounts of items in stores.
Selections:
- Date from – Default today
- Default to – Default today
- Stores – Default all
- Discounts – Default all
Output:
- Report shows for selected stores all discounts of items and percentage discount and gross profit of items in selected period of time.
- Summary for each column.
- One row per item number within selected date range
Columns:
- Date
- Item num. – Item number
- Item name
- Quantity
- Discounts
- Discount %
- GP % - Gross profit percentage
Interactive sorting:
- Date
- Discounts
- Discount %
- GP %
Source:
Lindbak POS Reporting Cube (OLAP)

Description:
Report lists inventory adjustments in stores.
Selections:
- Date from – Default today
- Date to – Default today
- Store – Default all
- Transaction type – Default all
Output:
- Report shows adjustments of products with reason codes in selected stores.
- Every store and reason code has a summary of quantity and total cost.
- One page per store.
Columns:
- Buttons for expanding and collapsing all drilldowns
- Item
- Quantity
- Net price
- Net cost price
- Total cost
Clarifications:
Item Transactions are used, filtering based on Reason Codes dim.
Source:
- Lindbak POS Reporting Cube (OLAP)

Description:
Report lists cashiers turnovers at a particular day.
Selections:
- Date – Default today
Output:
Report is presented as file to csv export without any colors.
Columns:
- Operator Number
- Operator Name
- Retail Store num – Retail store number
- Retail Store Name
- Hour – Hour of day
- Qty. – Quantity Amount
- UPT - Units per transaction
- ATV - Average transactions value
- Sales Selected Month
Source:
- Lindbak POS Reporting Cube (OLAP)

Description:
Report lists stores turnovers at a particular day.
Selections:
- Date – Default today
Output:
Report is presented as file to csv exportwithout any colors.
Columns:
- Retail Store num – Retail store number
- Retail Store Name
- Hour – Hour of day
- Quantity
- Amount UPT - Units per transaction
- ATV - Average transactions value
- Sales Selected Month
Source:
Lindbak POS Reporting Cube (OLAP)

Description:
Report lists cashiers turnovers on a particular day per receipt.
Selections:
- Date – Default today
Output:
Report is presented as file to csv exportwithout any colors.
Columns:
- Cashier_number
- User_name – Cashier name
- Store_number Store_name
- Hour_of_day
- Receipt_id
- Singlesale_grandtotal - sale Amount
Source:
- Lindbak POS Reporting Cube (OLAP)

Description:
Report lists sales statistics with drilldown.
Selections:
- Date from – Default today
- Date to – Default today
- Stores – Default all
- Operator – Default all
- Item Identifier – Default all
Output:
- One page per store.
- Report has a summary for all selected stores at the end of report.
- Summary totals in the beginning of new hierarchy level for:
- Store
- Item group
- Subgroup
Columns:
- Buttons for expanding and collapsing all drilldowns.
- EAN
- Item name
- Item ID
- Total Campaign – Campaign sale quantity
- Share – Percentage turnover with tax
- % - Pecentage of campaign sale
Source:
- Lindbak POS Reporting Cube (OLAP)

Description:
Report lists sales table by cashiers for each store and summary sales table by stores.
Selections:
- Date from – Default today
- Date to – Default today
- Store – Default all
- Article group – Default all
Output:
- Report shows sales table for cashiers in store.
- One page per store.
- The second table for all stores is at the end of report.
- Report has a summary totals for each column in both tables.
Columns:
- For cashiers:
- Number – Cashier number
- Cashier name
- For stores:
- Store – Store number and store name
- Number - Quantity Sales amount
- Discount % - Discount percentage
- Gr. prof % - Gross profit percentage
- Gross profit
Interactive sorting:
Interactive sorting on Cashier name, Number and Gross.
Source:
- Lindbak POS Reporting Cube (OLAP)

Description:
Report lists sales for selected storse in selected period of time.
Selections:
- Date from – Default today
- Date to – Default today
- Store – Default all
Output:
- Report lists total sales, one store per row.
- Report sum up every column.
Columns:
- Store num. – Store number
- Store name Total sales
- Quantity
- Customers
- ATV – Average tranaction value
- UPT – Units per transaction
- Gr. prof. % - Gross profit percentage
- Makeup % - Article group sales percentage
Interactive sorting:
Interactive sorting on all except Makeup %.
Source:
Lindbak POS Reporting Cube (OLAP)

Description:
Report lists bestseller products in each store.
Selections:
- Date from – Default today
- Date to – Default today
- Count – Default 10
- Team – Default all
- Profile – Default all
- Store – Default all
- Sort – Default best
- Accumulation – Default: OverAll + Store
- Measure – Default: Amount
Output:
Report lists bestseller items with quantity and gross profit for seleected period of time for each selected store, one page per store.
Columns:
- EAN
- Item name
- Quantity
- Amount in thousand
- Gross profit
- Gross profit % - Gross profit percentage
Source:
Lindbak POS Reporting Cube (OLAP)

Description:
Report lists number of sales every quarter for each store and total number of sales for all stores.
Selections:
- Date from – Default today
- Date to – Default today
- Team – Default all
- Store – Default avaible from the list
- Weekday – Default all
- Hour from – Default 8
- Hour to – Default 18
Output:
- Report shows number of sales every quarter table in selected period of time (date and hours) for each store.
- One page per store.
- Second table shows numbers of sales all stores together and it's at the end of report.
- Report has a summary totals for each column in both tables
Columns:
- Time – Next quarters of selected period of hours
- Sales – Net amount
- Customers num – Customer number transactions
- Items – Quantity of items
Clarifications:
All used values in report are selected for: not deleted Status, stock type article and for regular sales.
Source:
- Lindbak POS Reporting DW

Description:
Report lists mix sales for articles in a particular store.
Selections:
- Date from – Default today
- Date to – Default today
- Store From – Select a single value
- Mixnumber – Select a single value
- Non sale – Default false
Output:
Report has a mix sales summary at the end of report.
Columns:
- EAN
- Item name
- Mix sales - Quantity
Source:
- Lindbak POS Reporting DW

Description:
Report lists sales per month for each store and comparison month from last year.
Selections:
- Date from – Default today
- Date to – Default today
- Store – Default all
- Department – Default all
- Article Area – Default all
- Article Group – Default all
Output:
- Report shows sales per month and per year in stores in comparison to year before.
- Report has a summary for each column.
- Summary totals in the beginning of new hierarchy level for:
- Store
- Department
- Item area
- Item group
Columns:
- Buttons for expanding and collapsing all drilldowns.
- EAN
- Item name
- Sales – Net amount for month and year respectively
- Last year – Net amount for month/year in a current date year before
- Diff. LY – Difference between current date and date year before
- Index LY – Index current date to a date year before
Source:
- Lindbak POS Reporting Cube (OLAP)
CO attached to PBI #12200

Description:
- Report allows to check Nonsale quantity among stores and cashiers.
Selections:
- Date from: Default today
- Date to: Default today
- Retail store: Default all
- Operator: Default all
Output:
One row per item showing quantity of nonsale transaction on given item. Total per each cashier and per each store.
Columns:
- EAN
- Item name
- Quantity
Sorting:
- Store number
- Cashier number
Source:
- Lindbak POS Reporting cube (OLAP)
PBI: 12060, IN94

Description:
Report lists amount and quantity of different discounts made by cashiers.
Selections:
- Date from – Default today
- Date to – Default today
- Store – Single value, availe from the list
Output:
- After expanding cashiers, list of receipts.
- One row per receipt.
- Summary totals in the beginning of new hierarchy level for Cashier.
- Report has a summary for all cashiers in store on each column.
Columns:
- Buttons for expanding and collapsing all drilldowns
- Receipt – Receipt id
- Date – Date of transaction
- Amount – Amount of discount
- Quantity – Quantity of discounts
Source:
- Lindbak POS Reporting Cube (OLAP)
PBI: 39373

Description:
Report lists cashier statistics.
Selections:
- Date from – Default today
- Date to – Default today
- Retailstore – Default all
- Operator – Default all
Output:
- Report shows list of cahiers in each store.
- One page per store
- Report has a summary for each colum at the end each store table
Columns:
- Cashier – Cashier number and name
- Turnover – Turnover amount
- Receipts – Receipts quantity
- Qty - Quantity Amount
- Null – Null sales with open drawer
- Ovr. prc. – Overriden price quantity
- Scan – Scanned articles
- Lottery – Tender type finance amount and quantity
Source:
- Lindbak POS Reporting Cube (OLAP)
CO: 1044

Description:
Report lists detailed information about Breakage and complaint items. Its quantity, amount, breakage and compplaint by team and store and grouped by worst registered items.
Selections:
- Date from – Default today
- Date to – Default today
- Team – Default all
Output:
Report is devided in 6 sections:
- List of breakage and complaint items, its reason codes with quantity and amount.
- Table of breakage and complaint items quantity grouped by team and store.
- Bar chart with worst 20 item registered with complaints and breakage.
- List of breakage and complaint items. (Section 4 chart)
- Bar chart with complaints and breakage per item group.
- List of item groups and amounts for breakage and complaint. (5 chart)
Columns:
- Section 1
- Transaction type
- Reason code
- Quantity
- Amount
- Section 2
- Store – Store number and store name preceded by team group
- Breakage – Quantity of Breakage items
- Complaint – Quantity of Complaint items
- Total – Total quantity of breakage and complaint items
- Section 3
- X-axis – Item number, quantity and amount bars
- Y-axis – Left axis quantity, right axis amount
- Section 4
- Item num. – Item number
- Item name
- Quantity – Item transaction quantity
- Amount – Item transaction net amount
- Section 5
- X-axis – item group, complaint and breakage bars
- Y-axis – Item transaction net amount
- Section 6
- Item group
- Amount for breakage
- Amount for complaint
Clarifications:
Chart from section 3 is presented as list in section 4 and chart from section 5 is presented as list in section 6.
Source:
- Lindbak POS Reporting Cube (OLAP)
CO: 1045

Descriptions:
Report lists dashboard about sales in cashregister per store.
Selections:
- Date- Default today
- Store – Default all
- Include VAT – Default Yes
Output:
Report shows three tables:
- First and second table shows accumulated sales from week and current day.
- Third table shows differences current day Report shows two gauge panels with sales to budget ratio week and day
Columns:
- Accumulated current day/week
- Sales – Sales amount
- Sales until 24 – Sales amount before 24
- Sales until 24 LY – Sales amount before 24 last year
- Budget – Budget amount with tax
- Average sales
- Average sales last year
- Differences current day
- Open drawer count
- Returns qty. – Quantity of returns
- Returns (total) – Total returns amount
- Cancelled receipts
Source:
- Lindbak POS Reporting Cube (OLAP)
CO: 1137

Descriptions:
Report lists dashboard about sales in cashregister per team.
Selections:
- Date- Default today
- Team – Default all
- Include VAT – Default Yes
Output:
Report shows three tables:
- First and second table shows accumulated sales from week and current day.
- Third table shows differences current day Report shows two gauge panels with sales to budget ratio week and day
Columns:
- Accumulated current day/week
- Sales – Sales amount
- Sales until 24 – Sales amount before 24
- Sales until 24 LY – Sales amount before 24 last year
- Budget – Budget amount with tax
- Average sales
- Average sales last year
- Differences current day
- Open drawer count
- Returns qty. – Quantity of returns
- Returns (total) – Total returns amount
- Cancelled receipts
Source:
- Lindbak POS Reporting Cube (OLAP)

Description:
Report lists security statistics of cashiers in stores.
Selections:
- Date from – Default all
- Date to – Default all
- Team – Default all
- Store – Default all
- Operator – Default all
Output:
Report shows statistics of cashiers after expanding stores. Summary totals in the beginning of new hierarchy level for Store.
Columns:
- Buttons for expanding and collapsing all drilldowns
- Store – Store number and store name
- Diff. balance – Difference balance in store between balance amount, tender amout and cash bank
- Returns qty. – Returns quantity Returns amt. – Returns amount
- Deleted receipts quantity
- Deleted unfinished receipts
- Deleted receipts amount
- Receipt copies – Receipt copies quantity
- Open drawer – Open drawer quantity
- Employe disc. – Personal discount quantity
- Employee disc. amt. – Personal discount amount
- Breakage – Breakage amount in store
- Turnover sum – Turnover amount
- Deposit refund received qty – Deposit refund received quantity
- Deposit refund received – Deposit refunt received amount
- Deleted sales qty – Deleted sales quantity
- Deleted sales amount
- Total amount – Card payment
Interactive Sorting:
Interactive sorting on all columns except deleted unifinished receipts and deleted receipts amount.
Clarifications:
Report has two buttons to expand and collapse all stores.
Source:
- Lindbak POS Reporting Cube (OLAP)

Description:
Report lists data for floor planning system.
Selections:
- Date - Default today
Output:
Report shows sales data for floorplanning.
Columns:
- StoreNumber
- Date
- Amount
- CustomerCount – Receipts quantity
- Quantity
Source:
- Lindbak POS Reporting Cube (OLAP)

Description:
Report lists daily total net amount for a store.
Selections:
- Date – Default today
- Retail store – Possible to select one store or all available
- Workstation – Default all
Output:
One page per store. Each table has a summary of each column.
Columns:
- Workstation
- Net amount
- Items per purchase
- Net amount per customer
Interactive sorting:
Interactive sorting on all columns
Source:
- Lindbak POS Reporting Cube (OLAP)

Description:
Report lists sale per cashier in each store.
Selections:
- Date from – Default today
- Date to – Default today
- RetailStore - Possible to select one store or all available
- Workstation – Default all
Output:
Report shows quantity and amount of sales for each cahier in selected store. There is a summary for each column.
One page per store
Columns:
- Seller nr – Operator number
- Seller name – Operator name
- Quantity
- Amount
Source:
- Lindbak POS Reporting Cube (OLAP)

Description:
Report lists item group sales.
Selections:
- Date from – Default today
- Date to – Default today
- RetailStore - Possible to select one store or all available
- Workstation – Default all
Output:
Report lists item group quantity and amount for selected stores, one page per store. There is a summary for each column.
Columns:
- Grp. no. – Item group number
- Item group
- Quantity
- Amount
Interactive sorting:
Interactive sorting on all columns
Source:
- Lindbak POS Reporting Cube (OLAP)

Description:
Report allows to follow up store settlement: on first page settlement for all selected workstations and settlement per each workstation on following pages. Report is divided in subreports wchich will be described separatly.
Selections (applies to all subreports):
- Date from – Default today
- Date to – Default today
- Retail store – Default select a single value
- Workstation – Default all
Output:
One page per workstation. First page with report table contains all workstations.
Subreports:
Rows:
- Gross amount: Amount inc. VAT + General discount - Returns
- Deducted bonus check: Return amount on article group set in hidden parameter: pBonusCheckArticleGroup
- Return total: All rerutns amount - Deducted bonus check
- General discount: Discount amount with keys: Line and Subtotal
__________________________________________________________________________________
- Net amount - 0% tax: Net amount with 0% tax
- Net amount - other taxes: Net amount
- Tax total: tax amount
- Rounding: Subtotal rounding amount
__________________________________________________________________________________
- Net amount rounded: both Net amounts + Rounding
- Shoes serviece (Store cost and total): balance amount with tender type: InboundChangeBalance; Sales inc. VAT per article with article type: Service
- Inbound change: Return amount per article with article type: Service
- Outbound change: Remaining Amoun tIn Drawer; difference: Remaining Amoun tIn Drawer - balance amount with tender type: InboundChangeBalance
Rows:
- Gross sale amount: Amount inc. VAT
Total%:
- Deposit refund: Deposit refound amount / Gross sale amount
- Returned items: Returned items amount/ Gross sale amount
- Deleted sales: Deleted amount/ Gross sale amount
- Deleted reciept: Deleted receipts amount/ Gross sale amount
- Scanned: Scanned quantity/ Gross sale qunatity
Columns:
- Tax group: tax type
- Tax base: Net amount
- Tax amount: tax
- Sum: Turnover inc. VAT
Rows:
- One row per one tax type
Columns:
- Qunatity
- Qunatity %: Share of given tender type quantity in whole quantity
- Amount: Sales inc. VAT per tender type
Rows:
- One row per one tender type
Description:
Amount inc. VAT and quantity of items returned. One row per reason code.
Description:
Nonsale Amount and number of transactions per article.
Clarification:
Articles to displayed can be narrowed down by changing parameter: pArticlesSet
Source:
Lindbak POS Reporting Cube (OLAP)
CO: 190361, RTC-16608

Description:
Report lists number of members with and without bonus points and pie chart.
Selections:
- Loyalty program – Default loyalty program
Output:
Report shows number of members with and without bonus points and pie chart which related to table.
Columns:
- Total number of members
- Number of member with bonus points
- Number of member without bonus points
- Total bonus point amount
Source:
- Lindbak POS Reporting Cube (OLAP)
CO: 190338

Description:
Report allows to follow up bonus rollout checks usage and sales made using bonus checks.
Selections:
- Year from (default last year)
- Year to (default current year)
- Bonus rollout name (default all) - report shows data for available rollouts within selected period
- Loyalty program
Output:
Bonus checks usage and sales statistics grouped per store. Report lists all the stores in which checks were issued or redeemed.
Columns:
- Store - StoreNumber - Store name
- Number redeemed - Number of redeemed bonus checks issued in selected rollout(s)
- Sum redeemed - Sum of redeemed bonus checks
- Redeemed of total issued % - Share of redeemed bonus checks number for store compared to issued bonus checks number for all stores
- Average sale - Average sale inc. VAT made using bonus checks
Sorting:
- StoreNumber
Clarifications:
- Check is considered redeemed even if it was only partialy used
- Check is conntected to the store in which it was redeemed, not issued
Source:
- Lindbak POS Reporting cube (OLAP)

Description:
Report lists sales per hour and per department for selected two dates.
Selections:
- Date 1 – Default today
- Date 2 – Default tomorrow day
- Store – Default all
- Department – Default all
- Store type – Default all
- Include VAT – Default Yes
Output:
- Report shows report table with turnover and gross profit for two dates with differences.
- Report has a summary of each column.
- Report has also two bar charts. First bar chart shows turnover per hour, second shows total turnover.
Columns:
- Hour – Each hour of a day
- Turnover – Turnover sales
- Gr. prof. % - Gross profit percentage
- Diff. sales – Difference sales
- Diff. sales % - Difference sales percentage
- Diff GP % - Difference gross profit percentage
- Turnover per hour chart
- X-axis – hour time for Date 1 and Date 2
- Y-axis – Sales amount
- Total turnover chart
- X-axis – Total time for Date 1 and Date 2
- Y-axis – Sales amount
Source:
- Lindbak POS Reporting Cube (OLAP)

Description:
Report lists loyalty statistic per week in selected year.
Selections:
- Loyalty program -Default 1
- Year – Default today
- Week- Default 4
Output:
Report shows new members in period and new members years to date in this year and last year for each store in selected year and week
Columns:
- Store – Store name
- This year
- Last year
- Diff % - Percentage difference between this year and last year
Source:
- Lindbak POS Reporting Cube (OLAP)
- Lindbak POS Reporting DW

Description:
Report lists members for selected parameters.
Selections:
- Loyalty program – Default loyalty program
- Date from – Default today
- Date to – Default today
- Sales from – Minimum sales amount on member
- Sales to – Maximum sales amount on member
- Top X (X=) – Number of top members
- Top X based on – Selection of measure on which Top X is selected
- Department – Default all
- Article group – Default all
- Sales store – Default all
- Gender – Default all
- Age group – Default 0
- Employees – Default exclude
- Not active members – Default exclude
- Only if accepts email – Default false
- Only if accepts SMS – Default false
- Per household – Default true
- Only OBOS members – Defaukt false
- EAN list – Default empty
- Assortment – Default all
- Vendor – Default all
- Brand – Default all
- Show only members that accepted 'Data analysis' – Default true
Output:
Report shows members list with all details about each member for many selections.
Columns:
- Member number
- Social ID
- Honorific
- Name
- Address
- Zipcode
- City
- Country
- Birth date
- Mobile
- Phone num. – Phone number
- Member store
- Barcode URL
- Amount
- Items Number of lines
- Num of receipts – Number of receipts
Clarifications:
Report table is too large to fit on one page and part of it is moved to the next page. Selection TOP X (X=) is responsible for number of rows displayed in the table.
Source:
- Lindbak POS Reporting Cube (OLAP)

Description:
Report lists sales statistics about each sold item in stores.
Selections:
- Date from – Default first day of the current month
- Date to – Default last day of the current month
- Store – Default all
- Vendor – Default all
- Assortment – Default all
- Subvendor – Deffualt all
- EAN list – Defaul empty
Output:
Report lists statistics about sold items, quantity, campaign sale and gross profit. Table has a summary for each column to sum up all selected stores in period of time.
Columns:
- EAN
- Item name
- Item ID
- Quantity sold
- Total – total quantity
- Campaign – Campaign sale quantity
- Turnover with tax
- Total – Total amount
- Share – Single amount to total amount in percentage
- Campaign sale
- Total – Campaign sale
- % - Campaign sale percentage
- Gross profit
- Total
- % - Gross profit percentage
- % exc. campaign – Gross profit in percentage excluding Campaign
- Campaign – Campaign gross profit
- Campaign % - Campagn gross profit percentage
Source:
- Lindbak POS Reporting Cube (OLAP)

Description:
Report lists Cashier security statistics.
Selections:
- Date from – Default today
- Date to – Default today
- Store – Default today
- Operator – Default all
Output:
Summary totals in the beginning of new hierarchy level for stores. After expanding,there is list of cashiers.
Columns:
- Buttons for expanding and collapsing all drilldowns.
- Store – Store number and store name
- Turnover – Turnover amount
- Amount
- % - Percentage of amount
- Null – Null sales
- Deleted item lines – Deleted item lines quantity
- Receipts on hold – Receipts on hold quantity
- Qty - Quantity
Source:
- Lindbak POS Reporting Cube (OLAP)
CO: 176619

Description:
Report shows all items which were not counted during inventory since given date.
Selection:
- Not counted since - Shows items that are not counted since this date. Default same date last month.
- Retail store - Only available for HQ users. Default first available store.
- Supplier - Filter result on supplier. Default all
- Item group - Filter result on item group. Default all
- Brand - Filter result on brand. Default all
- Show total only - If selected it will only show total, not any items. Default not selected.
Output:
All items which don't appear on last stocktaking. First row is total where under EAN there is a number of all items not counted.
Columns:
- Supplier - Supplier name
- EAN - EAN number
- Item number - Item number
- Item text - Item text
- Quantity - Last number in stock -Shows quantity from last stocktaking
- Net cost - Last Net cost - Shows total netcost for item from last stocktaking
Sorting:
- EAN
Source:
- Lindbak Retail database
CO: 225452
RTC-28001

Description:
Report lists changes in bonus balance and how much bonus is issued and used over a period of time
Selection:
- Loyalty id - Loyalty program, default 1
- Date From - Default today
- Date To - Default today
- Store - Default all
Output:
Bonus checks overview. For each store sum of issued, redeemed, spent, expired and balance bonus checks with number of sales and members who got/used bonus. Next table with issued amount and member with bonus independent of chosen period. Total sum of each column for all selected stores.
Columns:
- Members with bonus - Number of members with bonus amount balance greater than 0 (independent of chosen period)
- Issued amount - Total bonus amount issued (independent of chosen period)
- Store num - Store number
- Store name - Store name (default sorted on this column)
- Total - The sum of issued amount in the selected period
- Ordinary sales - The sum of bonus amount issued after purchases in the selected period
- Manual checks - The sum of bonus amount issued manually in the selected period
- Spent bonus - total sum of redeemed amount in the selected period
- Expired bonus - Total sum of amount that expires in the selected period (check expiration date is between date from and date to)
- Receipts paid with bonus - Number of sales (receipts) paid with bonus checks in the selected period
- Members who used bonus - Number of unique members who have used bonus, redeemed transaction in the selected period
- Member who got bonus - Number of unique members who got bonus, issued transaction in the selected period
- Bonus balance - Sum of not-expired bonus amount at the end of the selected period
Clarifications:
- Receipts paid with bonus column shows count values selected on distinct member number and distinct transaction date, it resolves issues with the same transaction id at different webshops.
- All data is based on FactMemberTransaction.
Source:
- Lindbak POS Reporting DW

Description:
Report lists ranking of sold items per hour.
Selections:
- Team – Default all
- Store – Default all
- Date from – Default today
- Date to – Default today
- Article group – Default all
- Type – Default Top
- Top X – Default 10 top items
Output:
Report shows top X items sold per hour. Hour column is dependent from sales and will avaible if item will sold.
Columns:
- Rank – Ranking position
- PLU – EAN item
- Name – Article name
- Quantity
Clarifications:
Report can show all hours and sales made in selected period of time. It can be full 0-24. To better presentation of report, some hour columns was cut from table manually.
Source:
- Lindbak POS Reporting Cube (OLAP)

Description:
Report lists ranking of bestseller items, best cashiers and stores in the country and in a particular store.
Selections:
- Date from – Default today
- Date to – default today
- Store – Default store number 103
- District – Default Team number 25
Output:
Report is divided on 6 tables:
- Top 10 items in the country in all stores
- Top 10 items in the store (default 103)
- Top 10 cashiers in the country in all stores
- Top 5 cashiers in the store (default 103)
- Top 5 stores in the country
- Top 5 store in district (default chosen District 25)
Columns:
- Table 1 and table 2
- EAN
- Item name
- Quantity
- Table 3
- Store – Store number
- Store name
- Cashier – Cashier number Cashier name
- Amount
- Table 4
- Cashier – Cashier number
- Cashier name
- Amount
- Table 5 and Table 6
- Store – Store number
- Store name
- Amount
Source:
- Lindbak POS Reporting Cube (OLAP)
CO10145

Description:
Report lists statistics about cashiers in stores.
Selections:
- Date from – Default today
- Date to – Defaul today
- Store – Default all
- Operator – Default all
Relevant parameters:
pBalanceTenderType – setting tenders for for balance to type cash
Output:
Report show statistics about quantity and amount from receipts, items, giftcards and discounts for cashiers in selected stores and period of time.
Columns:
- Store No – Store number
- Store name
- Cashier No – Cashier number
- Cashier name
- Sales ex/VAT – Net amount
- Receipts Qty – Receipts quantity
- Complaint Qty – Return quantity
- Complaint Amount – Return amount
- Returns excl. reclamations Qty – Returns excluding reclamation quantity
- Return excl. reclamations Amount – Returns exluding reclamation amount
- Deleted item lines Qty – Deleted item lines quantity
- Deleted item lines amount
- Receipts on hold Qty – Receipts on hold quantity
- Receipts on hold amount
- Deleted on hold Qty – Deleted receipts on hold quantity
- Deleted on hold amount – Deleted receitps on hold amount
- Null – Null sales
- Scanned – Scanned articles percentage
- Credit note Qty – Issued credit note quantity
- Credit note amount – Issued credit note amount
- Gift card Qty – Gift card quantity
- Gift card amount
- Diff – Balance difference
- Personnel discount Receipts
- Personnel discount Amount
- Line discount Qty – Line discount quantity
- Line discount Amount
- Open drawer – Open drawer quantity
Interactive Sorting:
Interactive sorting on all columns except Returns excl. reclamations, Deleted item lines gift card, and open drawer
Clarifications:
Report table is too large to fit on one page and part of it is moved to the next page
Source:
- Lindbak POS Reporting Cube (OLAP)

Description:
Report lists sales statistics of selected stores.
Selections:
- Date from – Default today
- Date to – Default today
- Store – Default all
Output:
Report shows simple sales statistics (net amount and quantity) for selected stores and selected period of time. Report has a summary for each column.
Columns:
- No – Store number
- Name – Store name
- Net amount – Sales net amount
- Qty – Quantity of receipts
Clarifications:
Report has a 2 textboxes above report table to show dates about printing and data updating.
Source:
- Lindbak POS Reporting Cube (OLAP)
- Lindbak POS Reporting DW

Descriptions:
Report lists all manual discounts for all Cashiers in selected stores.
Selections:
- Date from – Default today
- Date to – Default today Store – Default all
- Operator – Default all
- Reason code – Default all
Output:
Report lists item number with manual discount per cashier name in selected stores. Quantity and Discount are summed up at the end of report.
Columns:
- Store – Store number
- Number – Operator number
- Cashier name – Cashier full name
- Item num. – item number
- Item name
- Quantity
- Reason code
- Discount - Discount of article
- Discount %
Sorting:
- Interactive sorting on all columns
Source:
- Lindbak POS Reporting cube (OLAP)
CO: 10637, PBI#119080

Description:
Report lists cashiers settlements.
Selections:
- Date from – Defualt today
- Date to – Default today
- Store - Default all
- Workstation – Default today
Output:
- Report shows information about cashier's settlement in selected stores and period of time.
- One page per store.
- Summary totals in the beginning of new hierarchy level for workstations.
- Report has a summary for each column for each store table.
Columns:
- Buttons for expanding and collapsing all drilldowns
- Workstation/Operator – Workstation name and operator number and operator name after expanding
- Sales – sales amount
- Invoice – Invoice tender amount
- Lottery tickets – Finance tender amount
- Bal. lottery tickets – Finance balance amount
- Diff lottery tickets – Difference balance amount
- Number of coupons
- Coupon amount
- Used giftcards – Received gift cards amount
- Used credit notes
- Returned qty. – Returns quantity
- Returned amt. – Returns amount
- Cash – Received cash amount and drop amount
- Balance cash amt. – Balance cash amount
- Cash diff – Cash difference
Clarifications:
Columns with balance and difference values are used only for workstations.
Source:
- Lindbak POS Reporting Cube (OLAP)
CO-96179

Descriptions:
Report shows detailed customer club sales.
Selections:
- Date – Default today
- Store – Default all
Output:
Report lists receipts with price and number of items for selected stores and particular day.
Columns:
- Store – Store number
- Workstation – Workstation number
- Cashier – Cashier number
- Receipt
- Member number
- Sales incl. VAT – Sales including VAT
- Sales excl. VAT – Sales excluding VAT
- Items – quantity of items
Source:
- Lindbak POS Reporting DW
CO: 156791. Based on report 0709.
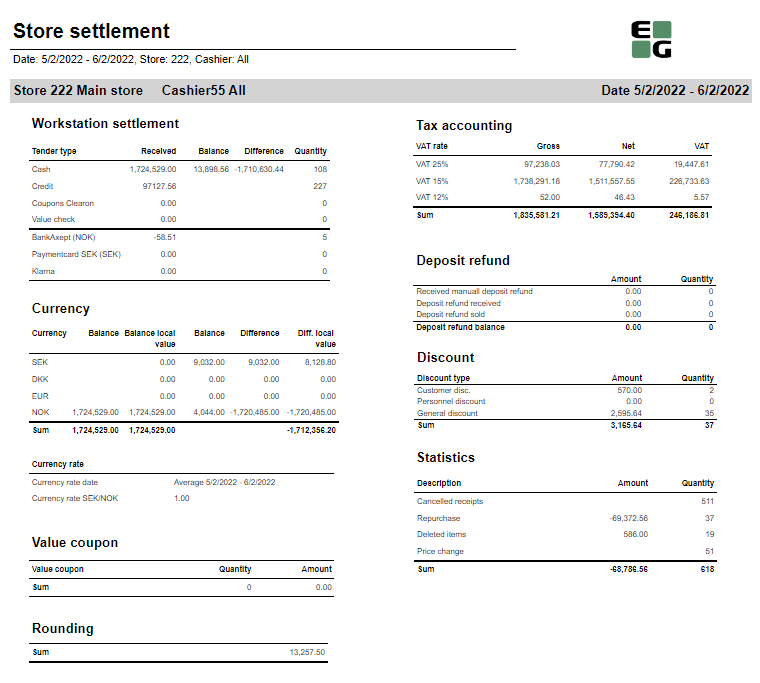
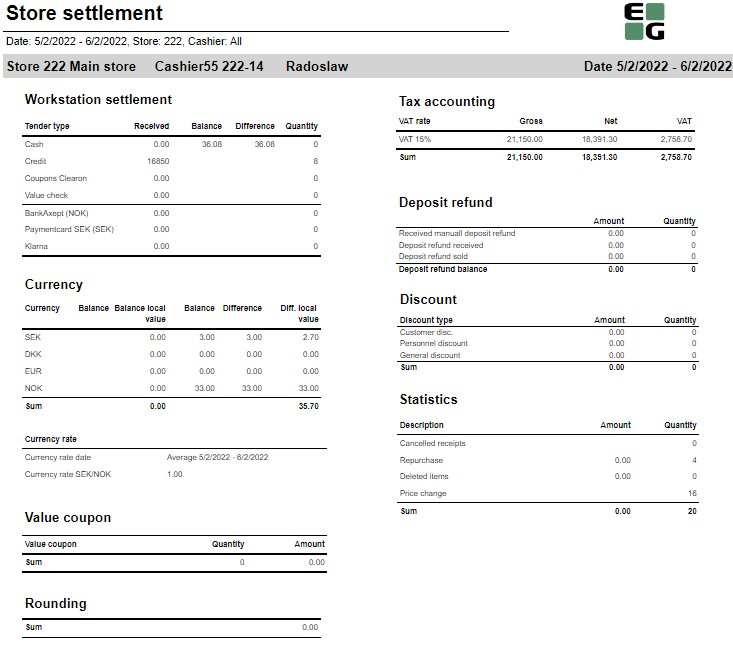
Description:
Report allows to follow up store settlement: on first page settlement for all selected cashiers (if all cashiers are selected it equals whole store settlement) and settlement per each cashier on following pages. Report is divided in 9 subreports which will be descriped separatly below.
Selections (applies to all subreports):
- Date from - Default today
- Date to - Default today
- Store - Default all
- Operator -Default all
Subreports:
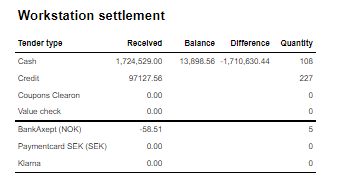
Columns:
- Tender type - payment method
- Received - Sales amount inc. VAT received in given tender type
- Balance - Money amount registered in the end of the day (sum for selected operators who made balance and selected days)
- Difference - Balance - Received
- Qunatity - Number of items sold in given tender type
Output:
One row per one tender type
Clarifications:
- Balance and Difference make sense only for cash since only cash it's kept in cash register.
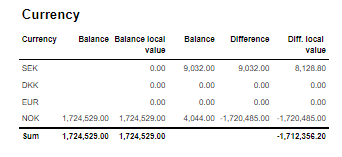
Columns:
- Currency
- Balance (Beholdning): Sales amount inc. VAT in main currency
- Balance local value: Sales amount inc. VAT in received currency
- Balance (Oppgjør): Money amount registered in the end of the day in given currency (sum for selected operators who made balance and selected days)
- Difference: Balance (Oppgjør) - Balance (Beholdning)
- Diff. local value: Balance (Money amount registered in the end of the day) in main currency - Balance local value
Description:
Average currency rate (rigidly set to SEK/NOK) for given period.
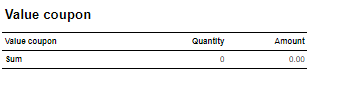
Description:
This subreport shows sum sales amount inc. VAT and sales sum quantity for EAN set in hidden parameter: pValueCouponEAN (default: 926)
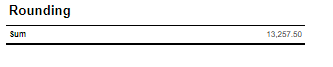
Description:
Sum of all transactions subtotal rounding (for given period, store and operators)
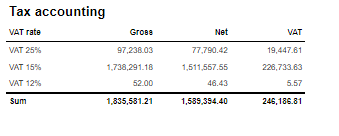
Coumns:
- Gross: Sales amount inc. VAT
- Net: Sales net amount
- VAT
Output:
One row per sum one type of VAT. Vaules are summed for given store, date period and operators
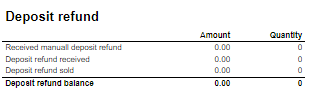
Columns:
- Amount: Sales amount inc. VAT
- Qunatity: Number of receipts.
Rows:
- Received manuall deposit refund: Amount direction in per item group set in hidden parameter: pArtGrpManualDepositRefundIn (default: 502)
- Deposit refund received: Amount for direction in per item group set in hidden parameter: pArtGrpDepositRefundIn (default: 501)
- Deposit refund sold: Sales per item group set in hidden parameter: pArtGrpDepositRefundSold (default: 500)
- Deposit refund balance: sum of 3 values above
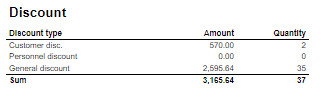
Coulmns:
- Amount: Discount amount
- Quantity: Number of receipts with discount
Rows:
- Customer disc.: discount with discount key: CustomerGroup
- Personnel discount: discount for employees with discount key: Subtotal
- General discount: discount with key: Line
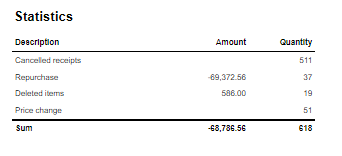
Columns:
- Amount: Sales amount inc. VAT (valid only for Repurchase and Price change)
- Qunatity: Number of receipts for Cancelled receipts and Repurchase; number of items for Deleted items and Price change
Rows:
- Cancelled receipts: Number of deleted/cancelled receipts
- Repurchase: All returns except those for item groups set in hidden parameters: pArtGrpManualDepositRefundIn (default 502) and pArtGrpDepositRefundIn (default 501)
- Deleted items: Items from Cancelled receipts
- Price change: Number of items sold with changed price
Source:
- Lindbak POS Reporting cube (OLAP)
CO-167575

Descriptions:
Report lists broken and waisted items.
Selections:
- Date from – Default today
- Date to – Default today
- Store – Default all
- Subvendor – Default all
- Article area – Default all
- Article group – Default all
- Transaction type – Default all
- Reason code – Default all
Relevant parameters:
- pTransactionTypesToExclude - Comma separated list of transactions types not to show in list of transaction types.
Output:
Report shows items, their transaction type with price and quantity for selected stores and their subvendors.
Columns:
- Store – Store number and store name
- Subvendor – Subvendor number and subvendor name
- EAN
- Item name
- Item number
- Number - Cashier number T
- ransaction type
- Reason code
- Date - Date of transaction
- Net price
- Quantity
- Net price total – Total net price number of items
Clarifications:
Report allow to show same items with different transaction types and sum up of quantity and price. It happens under each selected subvendor, which is placed under selected store.
Source:
- Lindbak POS Reporting Cube (OLAP)
CO: 162073

Description:
Report lists sales and comparison dates sales by product area.
Selections:
- Date from – Default today
- Date to – Default today
- Compare date from - Default the same day of week as Date from year before
- Compare date to - Default the same day of week as Date to but year before
- Article area – Default all
- Article group – Default all
- Store – Default all
- Report type – Default area
Output:
Report shows sales by product area or group with comparison sales in selected period of time and stores. Report has a summary for each column.
Columns:
- Article area – Article number and name
- Sales incl. VAT – Sales including VAT
- Sales ex. VAT – Sales excluding VAT
- Total % - Total amount percentage
- Quantity
- Price pr. Art. – Price per article
- Amount – Gross profit Amount
- % - Gross profit percentage
- Diff. - Difference
- Diff % - Difference percentage
Source:
- Lindbak POS Reporting Cube (OLAP)

Description:
Report lists sale statistic of items in stores
Selections:
- Date from – Default today
- Date to – Default today
- Store – Default all
- Vendor – Default all
- Assortment – Default all
- EAN list – Default empty
- Subvendor – Default all
Relevant parameters:
pArticleIdentifier – Parameter identifies ItemID of article
Output:
- Report shows statistics about items, quantity, campaing and gross profit for selected stores in period of time.
- One row per article.
- Report has a summary of each column.
Columns:
- EAN
- Item name
- Item ID
- Quantity sold Total
- Quantity sold Campaign
- Turnover with tax Total
- Turnover with tax Share
- Campaign sale Total
- Campaign sale % - Campaign sale percentage
- Gross profit Total
- Gross profit % - Gross profit percentage
- Gross profit % exc. Campaign – Gross profit percentage excluding campaign
- Gross profit Campaign
- Gross profit Campaign % - Gross profit campaign percentage
Interactive sorting:
Interactive sorting on all columns
Source:
- Lindbak POS Reporting Cube (OLAP)

Description:
Report lists sales and comparison dates sales by product area.
Selections:
- Date from – Default today
- Date to – Default today
- Compare date from - Default the same day of week as Date from year before
- Compare date to - Default the same day of week as Date to but year before
- Article area – Default all
- Article group – Default all
- Store – Default all
- Price channels – Default all
- Report type – Default area
Output:
- Report shows sales by product area or group with comparison sales in selected period of time and stores. Report has a summary for each column.
Columns:
- Article area – Article number and name
- Sales incl. VAT – Sales including VAT
- Sales ex. VAT – Sales excluding VAT
- Total % - Total amount percentage
- Quantity
- Price pr. Art. – Price per article
- Amount – Gross profit Amount
- % - Gross profit percentage
- Diff. - Difference
- Diff % - Difference percentage
Interactive sorting:
Interactive sorting on all columns.
Source:
- Lindbak POS Reporting Cube (OLAP)
CO: 190620

Description:
Report allows to follow upcoming and ongoing campaigns and also browse expired campaigns.
Selections:
- Date from - Default today
- Date to - Default today
- Store - Default all
- Apply date filter to - Start date (Date from <= Start date <= Date to)/ End date (Date from <= End date <= Date to)/ Ongoing (Date from <= End date and Date to <= Start date) - default Start date
- Status - Expired/Active/Not approved - default all
- Include profile campaigns -default false
Output:
One row per campaign
Columns:
- Store
- Campaign group
- Campaign ID
- Campaign name
- Status - Expired/Active/Not approved
- Start date
- Start time
- End date
- End time
- Created by
Sorting:
- Interactive sorting on all columns except time
Source:
- dsProgress
CO: 191144


Description:
Report allows to follow up article sales and waste grouped per store and per (item group or item area).
Selections:
- Date from - Default today
- Date to - Default today
- Store - Default all
- Article area - Default all
- Article group - Default all
- Reason Code - Default all
- Grouping - item area or item group - Default Item area
- Exclude items without breakage - Default false
Output:
Article sales and waste statistics grouped per store and per item group or item area sorted by highest Lost amount. There is a page break per each store and total all stores in the bottom of last page. If Exclude items without breakage parameter is set to true there will be only items with breakage.
Columns:
- Buttons for expanding and collapsing all drilldowns.
- ItemNo - Item number
- Item name
- Sales quantity - number of sold items
- Sales ex. VAT - sales amount ex. VAT
- Net cost - net cost of sold items
- Waste qty - number of broken items
- Lost amount - net cost of broken items
- Breakage % - share of Waste qty in Sales quantity
- Lost amount % - share of Lost amount in Net cost
Sorting:
- On all levels (store, area, group and item): by Lost amount from highest to lowest.
Clarifications:
- If there are no sales on items with breakage, Breakage % and Lost amount % will be 100%
Source:
- Lindbak POS Reporting cube (OLAP)

Description:
Report allows to follow up daily sales statistics per one of following: Store/Profile/Team/Total.
Selections:
- Date from: Default today
- Date to: Default today
- Week day from: Default Monady
- Week day to: Default Sunday - Report will show data only for selected week days
- Accumulation - Store/Profile/Team/Total - makes report show statistics per selected accumulation. If total is selected, the report shows sales per day per all stores.
- Team: Default all
- Profile: Defaul all
- Retail store: Default all
Output:
One page per selected accumulation(Store/Profile/Team/Total)
One row per day within selected date range and only day within Week day from and Week day to.
Columns:
- Date
- Gross sales
- Member disc.: Discount Key = MemberPrice
- Customer disc.: Discount Key = CustomerGroup
- Personel disc.: Discount Key = Personal
- Other discounts.
- Sales inc. VAT
- Sales ex. VAT
- Gross Profit
- Gr. proc. %: Share of gross profit in net amount
Sorting:
- Pages by accumulation
- Rows by date
Source:
- Lindbak POS Reporting cube (OLAP)
Standard report

Description:
Report allows to follow up nonsales statistics per item per Store or all stores.
Selections:
- Date from: Default today
- Date to: Default today
- Week day from: Default Monady
- Week day to: Default Sunday - Report will show data only for selected week days
- Accumulation - Store/Profile/Team/Total/Vendor - Should make report show statistics per selected accumulation. If total is selected, the report shows sales per day per all stores. Now only Store and total are working correctly
- Team: Default all
- Profile: Defaul all
- Retail store: Default all
- Department: Default all
- Article area: Default all
- Article group: Default all
- Article subgroup: Default all
- Vendor: Default all
- Assortment: Default all
- EAN from: Default all
- EAN to: Default all - range of ean can be manually set here
- Item ID from: Default all
- Item ID to: Default all - range of Item ID can be manually set here.
- Tandem: Dafault yes, if switched to no, then instead of EAN, Main EAN is shown in EAN column.
Output:
One page per selected accumulation(Store/Total)
One row per Article (EAN or Main EAN if tandem switched to no)
Article statistics are grouped on multile levels: Subgrouo, Group, Area, Department and
Columns:
- EAN
- Item name
- Quantity
- Ex. VAT Amount
- Ex. VAT Total %: Share of sales on given item(dept/area/group) to total store sale
- Gross profit Amount
- GP %: Share of gross profit in net amount
Sorting:
- Pages by store
- Rows by date
Source:
- Lindbak POS Reporting cube (OLAP)
Standard report

Description:
Report allows to follow up nonsales statistics per item per Store or all stores.
Selections:
- Date from: Default today
- Date to: Default today
- Week day: select days for which you're gonna see staistics; default Friday.
- Statistics: There you can set on which level you want your sales grouped.
- Item Subgroup sales
- Item Group sales
- Item Area sales
- Department sales
- Store sales
- Sales Ex. VAT: Yes/No
- Department: Default all
- Article area: Default all
- Article group: Default all
- Article subgroup: Default all
- Team: Default all
- Profile: Defaul all
- Retail store: Default all
Output:
One row per level selected in Statistics parameter.
Columns:
- Store num
- Sotre name
- Profile
- Day
- Week
- Month
- Year
- Dept no
- Dept name
- Area no
- Area name
- Sgr. no
- Subgr. name
- This year:
- Sales ex. VAT(inc. VAT if Sales ex VAT set to No)
- Gross profit
- Camp w. VAT sales inc .VAT with Discount Key = CampaignPrice
- Camp gr. prof.: Gross profit from campaign sales
- Items: Quantity of sold items
- Last year: Same stasitics as This year but last year
Sorting:
- Rows by store
Source:
- Lindbak POS Reporting cube (OLAP)

Description:
Report allows to follow up sales statistics on Department level.
Selections:
- Date from: Default today
- Date to: Default today
- Week day: Default Friday
- Department: Default all
- Article area: Default all
- Team: Default all
- Profile: Defaul all
- Retail store: Default all
Output:
One page per Store
One row per Department
Columns:
- Department:
- no
- Department
- Cost: Net cost
- Sales Amount
- w/VAT: Sales exc. VAT
- Gr. prof.
- In %: Share of Gross Profit in Net Amount
- Discount:
- Member disc.: Discount Key = MemberPrice
- Customer disc.: Discount Key = CustomerGroup
- Staff disc.: Discount Key = Personal
- Other: Other discounts sales amount
- Undiscounted Sales Amount
- Share of: Share of given department in all department sales
- Sales amount
- Gr. prof.
Sorting:
- Pages by store number
- Rows by department number
Source:
- Lindbak POS Reporting cube (OLAP)
Standard report

Description:
Report lists department sales for each item area in stores.
Selections:
- Date from – Default today
- Date to – Default today
- WeekDay – Default Monday
- Department – Default all
- Article group – Default all
- Team – Default all
- Profile – Default all
- Store – Default all
Relevant parameters:
pPriceChannels – hidden parameter use all price channels keys
Output:
- One page per store.
- Report has a summary for each store for each column at the end of table.
- Summary totals in the beginning of new hierarchy level for:
- Department
- Item area
Columns:
- Buttons for expanding and collapsing all drilldowns
- Grp. No. – Group number
- Gr. name – Group name
- Turnover ex. VAT Total – Total Turnover excluding VAT
- %/tot – Percentage of total
- Campaign – Campaign sales
- Gross profit Total
- Gr. prof. % - Gross profit percentage
- %/grp – Percentage of gross profit
Source:
- Lindbak POS Reporting Cube (OLAP)
Standard report


Description:
Report allows to follow up store settlement: on first page settlement for all selected cashiers (if all cashiers are selected it equals whole store settlement) and settlement per each cashier on following pages. Report is divided in subreports which will be descriped separatly below.
Selections (applies to all subreports):
- Date from: Default today
- Date to: Default today
- Team: Multivalue; default all
- Profile: Multivalue; default all
- Store: Single value; default first available from the list.
- Operator: Multivalue; default all
Subreports:
Columns:
- Quantity
- Amount
- Balance amount
- Difference: Balance amount - Amount
Rows:
One row per tender type . In means received, out means given (returns etc...)
- Cash: Tender type key = Cash or CashBack
- Check
- Coupon
- Finance
- Credit
- Gift card in
- Gift card out
- Gift card foreign in
- Gift card foreign out
- Credit note in
- Credit note foreign in
- Credit note out
- Bank: Tender Type Key = CreditDebit or CreditDebitOffline or ECreditDebit
- Subtotal: Total for all rows above Subtotal
______________________________________________________________________________________
- Deposit refound balance: Tender type key DepositRefund received - DepositRefund given
- Rounding: Subtotal rounding
- Paid in: Tender Control Type Key: PayedIn
- Payment on account: Tender Control Type Key: PaymentOnAccount
- Deposit: Article Type Key: Deposit
- Paid out: Tender Control Type Key: PayedOut
- Drop: Tender Control Type Key: Drop
Rows:
- Gross sale amount: Amount inc. VAT
Total%:
- Deposit refund: Deposit refound amount / Gross sale amount
- Returned items: Returned items amount/ Gross sale amount
- Deleted sales: Deleted amount/ Gross sale amount
- Deleted reciept: Deleted receipts amount/ Gross sale amount
- Scanned: Scanned quantity/ Gross sale qunatity
Columns:
- Tax group: tax type
- Tax base: Net amount
- Tax amount: tax
- Sum: Turnover inc. VAT
Rows:
- One row per one tax type
Rows:
- Bank: Amount for tender types: CreditDebit, CreditDebitOffline, ECreditDebit, Cash back
- Electronic giftcard: Amount for few hard coded payment card keys
- Offline: Amount for CreditDebitOffline
- Electronic giftcard out: Outcoming amount for few hard coded payment card keys
Columns:
- Amount: Sales amount inc. VAT
- Qunatity: Number of receipts.
Rows:
- Deposit refund received: Amount (or number of receipts) for direction in for Article Type Key: DepositRefund
- Deposit refund sold: Amount (or number of receipts) for direcion out for Article Type Key: DepositRefund
- Deposit refund balance: Received - sold
Columns:
- Qunatity
- Qunatity %: Share of given tender type quantity in whole quantity
- Amount: Sales inc. VAT per tender type
Rows:
- One row per one tender type
Source:
- Lindbak POS Reporting cube (OLAP)
Standard report


Description:
Report allows to follow up store settlement: on first page settlement for all selected workstations (if all cashiers are selected it equals whole store settlement) and settlement per each workstation on following pages. Report is divided in subreports which will be descriped separatly below.
Selections (applies to all subreports):
- Date from: Default today
- Date to: Default today
- Team: Multivalue; default all
- Profile: Multivalue; default all
- Store: Multivalue; default all
- Workstation: Multivalue; default all
Subreports:
Columns:
- Quantity
- Amount
- Balance amount
- Difference: Balance amount - Amount
Rows:
One row per tender type . In means received, out means given (returns etc...)
- Cash: Tender type key = Cash or CashBack
- Check
- Coupon
- Finance
- Credit
- Gift card in
- Gift card out
- Gift card foreign in
- Gift card foreign out
- Credit note in
- Credit note foreign in
- Credit note out
- Bank: Tender Type Key = CreditDebit or CreditDebitOffline or ECreditDebit
- Subtotal: Total for all rows above Subtotal
______________________________________________________________________________________
- Deposit refound balance: Tender type key DepositRefund received - DepositRefund given
- Rounding: Subtotal rounding
- Paid in: Tender Control Type Key: PayedIn
- Payment on account: Tender Control Type Key: PaymentOnAccount
- Deposit: Article Type Key: Deposit
- Paid out: Tender Control Type Key: PayedOut
- Drop: Tender Control Type Key: Drop
Rows:
- Gross sale amount: Amount inc. VAT
Total%:
- Deposit refund: Deposit refound amount / Gross sale amount
- Returned items: Returned items amount/ Gross sale amount
- Deleted sales: Deleted amount/ Gross sale amount
- Deleted reciept: Deleted receipts amount/ Gross sale amount
- Scanned: Scanned quantity/ Gross sale qunatity
Columns:
- Tax group: tax type
- Tax base: Net amount
- Tax amount: tax
- Sum: Turnover inc. VAT
Rows:
- One row per one tax type
Rows:
- Bank: Amount for tender types: CreditDebit, CreditDebitOffline, ECreditDebit, Cash back
- Electronic giftcard: Amount for few hard coded payment card keys
- Offline: Amount for CreditDebitOffline
- Electronic giftcard out: Outcoming amount for few hard coded payment card keys
Columns:
- Amount: Sales amount inc. VAT
- Qunatity: Number of receipts.
Rows:
- Deposit refund received: Amount (or number of receipts) for direction in for Article Type Key: DepositRefund
- Deposit refund sold: Amount (or number of receipts) for direcion out for Article Type Key: DepositRefund
- Deposit refund balance: Received - sold
Columns:
- Qunatity
- Qunatity %: Share of given tender type quantity in whole quantity
- Amount: Sales inc. VAT per tender type
Rows:
- One row per one tender type
Source:
- Lindbak POS Reporting cube (OLAP)
Standard report


Description:
Report allows to follow up meber and member sale statistics divided by member age and member gender.
Selections:
- Date from - Default today
- Date to - Default today
- Retail store - Default all
- Loyalty program
Output:
Report is devided in 5 sections:
- Graph and table showing number of members who joined in the selected date range, compared to the number of members who joined the year before.
- Sales statistics divided between members and not member customers
- Graph and table showing sales amount by gender and age groups
- Sale statistics divided by member seniority level
- Sale amount grouped per department, divided by gender
Columns:
- Section 1
- This year - number of members who joined in the selected date range,
- Last year - number of members who joined the year before selected date range
- Section 2
- Num of receipts
- Avg amount - (Sale amount inc. VAT)/(Num of receipts)
- Items - number of items sold
- Items/Cust - average number of sold items per customer
- Gross profit
- Gross profit % - Share of Gross profit in Sale amount
- Section 3
- Age group
- Sales inc. VAT
- Gross profit
- Gross profit % - Share of Gross profit in Sale amount
- Section 4
- level - member characteristic
- Num of receipts
- Avg amount - (Sale amount inc. VAT)/(Num of receipts)
- Items - number of items sold
- Items/Cust - average number of sold items per customer
- Gross profit
- Gross profit % - Share of Gross profit in Sale amount
- Section 5
- Department - Department name
- Female - Sale amount inc. VAT for scpecific department generated by women
- Female % - Share of sale amount inc. VAT for scpecific department generated by women in all sales inc. VAT across all departments and all genders
- Total -Sale amount inc. VAT for scpecific department
- Total % - Share of sale amount inc. VAT for scpecific department in all sales inc. VAT across all departments
Sorting:
- Section 3 - Age group
- Section 4 - Level
- Section 5 - Department name
Clarifications:
- This year, las year - if date range is 2020/01/01 - 2022-/01/01, then This year is 2020/01/01 - 2022-/01/01 and Last year is 2019/01/01 - 2021/01/01
Source:
- Lindbak POS Reporting cube (OLAP)
- Lindbak POS Reporting DW
Standard report

Description:
Report allows to follow up specific member activities.
Selections:
- Loyalty program: Dafault: 0 - Default loyalty program
- Date from: Default today
- Date to: Default today
- Member ID: Member key which needs to be written manually.
Output:
There are two sections:
- Member transactions: All transactions for given member in given date period
- Mamber sale: All sales made by given member in given date period
Columns:
- Member transactions
- Date
- Transaction Type: Transaction type from DimMemberActivity
- Activity name
- Bonus points
- Member sale:
- Date
- Amount: Amount inc. VAT
Source:
- Lindbak POS Reporting cube (OLAP)
Standard report

Description:
Report allows to follow up sales in specific locations.
Selections:
- Date time from: Date period is alway from 'Date time from' to today
- Retail store: Single selection. Default first from list.
- Workstations: Available workstations for given Retail store. Default: all available workstations for given Retail store.
- Article group: Default all
Output:
One row per one item sold in specific LocationKey from DimStockLocation. Data is presented per item group.
Columns:
- Model nr
- Item name
- Color
- Size
- EAN
- Price: Sum of sale amount inc. VAT.
- Quatity: Sum of sold item quantity.
Source:
- Lindbak POS Reporting cube (OLAP)
- Lindbak POS Reporting DW
Standard report

Description:
Report allows to follow usage of giftcards.
Selections:
- Date time from: Date period is alway from 'Date time from' to today
- Retail store: Single selection. Default first from list.
- Workstations: Available workstations for given Retail store. Default: all available workstations for given Retail store.
- Article group: Default all
Output:
One row per one item sold in specific LocationKey from DimStockLocation. Data is presented per item group.
Columns:
- Model nr
- Item name
- Color
- Size
- EAN
- Price: Sum of sale amount inc. VAT.
- Quatity: Sum of sold item quantity.
Source:
- Lindbak POS Reporting cube (OLAP)
- Lindbak POS Reporting DW

Description:
Report allows to follow up sales in specific locations.
Selections:
- Date time from: Date period is alway from 'Date time from' to today
- Retail store: Single selection. Default first from list.
- Workstations: Available workstations for given Retail store. Default: all available workstations for given Retail store.
- Article group: Default all
Output:
One row per one item sold in specific LocationKey from DimStockLocation. Data is presented per item group.
Columns:
- Model nr
- Item name
- Color
- Size
- EAN
- Price: Sum of sale amount inc. VAT.
- Quatity: Sum of sold item quantity.
Source:
- Lindbak POS Reporting DW


Description:
Report allows to follow up article sales on multiple levels with possibility to select specific hourly intervals and exclude specific item groups.
Selections:
- Date from - Default today
- Date to - Default today
- Hour from - Default 0:00
- Hour to - Default 24:00
- Team - Default all
- Store - Default all
- Department - Default all
- Article area - Default all
- Article group - Default all
- Include VAT - Default on
- Exclude groups - Default false
- Excluded groups - Appears when Exclude groups is switched to true
Output:
Article sale statistics for selected stores, for selected date interval and for selected time interval grouped by department, area and group.
By default data is shown for department and it is possible to drill down to item level manually by clicng plus button or by using expand all button to expand everithing to item level at once.
Columns:
- Buttons for expanding and collapsing all drilldowns.
- EAN - EAN code
- Item name - Article name
- Quantity
- Total- Quantity sold
- Turnover inc. VAT or Turnover ex. VAT depending on selection.
- Total - Amount sold. Inc. or ex. VAT depending on selection
- Share - Share of this department / area / group / item related to total sale.
- Cost price - Cost price
- Gross profit
- Total - Gross profit amount
- Total % - Gross profit percentage.
Sorting:
- Department number
- Item Area number
- Item Group number
- EAN
Clarifications:
- Hour selection applies to each day in selected date period
Source:
- Lindbak POS Reporting cube (OLAP)

Description:
Report allows to follow up sales in specific locations.
Selections:
- Date time from: Date period is alway from 'Date time from' to today
- Retail store: Single selection. Default first from list.
- Workstations: Available workstations for given Retail store. Default: all available workstations for given Retail store.
- Article group: Default all
Output:
One row per one item sold in specific LocationKey from DimStockLocation. Data is presented per item group.
Columns:
- Model nr
- Item name
- Color
- Size
- EAN
- Price: Sum of sale amount inc. VAT.
- Quatity: Sum of sold item quantity.
Source:
- Lindbak POS Reporting DW


Description:
Report allows to follow up store settlement: on first page settlement for all selected workstations (if all cashiers are selected it equals whole store settlement) and settlement per each workstation on following pages. Report is divided in subreports which will be descriped separatly below.
Selections (applies to all subreports):
- Date
- Store: Single value; default first
- Workstation: Single value; default first
Subreports:
Rows:
- Gross amount: Amount inc. VAT + General discount - Returns
- Deducted bonus check: Return amount on article group set in hidden parameter: pBonusCheckArticleGroup
- Return total: All rerutns amount - Deducted bonus check
- General discount: Discount amount with keys: Line and Subtotal
__________________________________________________________________________________
- Net amount - 0% tax: Net amount with 0% tax
- Net amount - other taxes: Net amount
- Tax total: tax amount
- Rounding: Subtotal rounding amount
__________________________________________________________________________________
- Net amount rounded: both Net amounts + Rounding
- Shoes serviece (Store cost and total): balance amount with tender type: InboundChangeBalance; Sales inc. VAT per article with article type: Service
- Inbound change: Return amount per article with article type: Service
- Outbound change: Remaining Amoun tIn Drawer; difference: Remaining Amoun tIn Drawer - balance amount with tender type: InboundChangeBalance
Rows:
- Gross sale amount: Amount inc. VAT
Total%:
- Deposit refund: Deposit refound amount / Gross sale amount
- Returned items: Returned items amount/ Gross sale amount
- Deleted sales: Deleted amount/ Gross sale amount
- Deleted reciept: Deleted receipts amount/ Gross sale amount
- Scanned: Scanned quantity/ Gross sale qunatity
Columns:
- Tax group: tax type
- Tax base: Net amount
- Tax amount: tax
- Sum: Turnover inc. VAT
Rows:
- One row per one tax type
Columns:
- Qunatity
- Qunatity %: Share of given tender type quantity in whole quantity
- Amount: Sales inc. VAT per tender type
Rows:
- One row per one tender type
Columns:
- Amount: Discount amount
- Quantity: quantity of items sold with given discount
- Total %: Share of given discount amount in all discounts amount
Rows:
- One row per one type of discount

Description:
Report allows to check new members.
Selections:
- Date from
- Date to
- Loyalty program
Output:
One row per new member
Columns:
- Member number
- First Name
- Last name
- Postal adress
- Main store: Store in which member was added
- Registered date
Source:
- Lindbak POS Reporting cube (OLAP)

Description:
Report allows to check new members.
Selections:
- Date from
- Date to
- Loyalty program
- Sales from: min Sales amount on member
- Sales to: max Sales amount on member
- Top X: number of top members
- Top X based on: selection of measure on which Top X is selected
- Department
- article group
- Retail Store
- Sex
- Age group
- Employee
- Active
- Email Status
- Mobile status
- EAN list
- Assortment
- Brand
Output:
One row per new member
Columns:
- Member number
- First Name
- Last name
- Postal adress
- Main store: Store in which member was added
- Registered date
Source:
- Lindbak POS Reporting cube (OLAP)


Description:
Report allows to follow up workstation settlement: on first page settlement for all selected workstations (if all cashiers are selected it equals whole store settlement) and settlement per each workstation on following pages. Report is divided in subreports which will be descriped separatly below.
Selections (applies to all subreports):
- Date
- Store: Single value; default first
- Workstation: Single value; default first
Subreports:
Rows:
- Gross amount: Amount inc. VAT + General discount - Returns
- Deducted bonus check: Return amount on article group set in hidden parameter: pBonusCheckArticleGroup
- Return total: All rerutns amount - Deducted bonus check
- General discount: Discount amount with keys: Line and Subtotal
__________________________________________________________________________________
- Net amount - 0% tax: Net amount with 0% tax
- Net amount - other taxes: Net amount
- Tax total: tax amount
- Rounding: Subtotal rounding amount
__________________________________________________________________________________
- Net amount rounded: both Net amounts + Rounding
- Shoes serviece (Store cost and total): balance amount with tender type: InboundChangeBalance; Sales inc. VAT per article with article type: Service
- Inbound change: Return amount per article with article type: Service
- Outbound change: Remaining Amoun tIn Drawer; difference: Remaining Amoun tIn Drawer - balance amount with tender type: InboundChangeBalance
Columns:
- Tax group: tax type
- Tax base: Net amount
- Tax amount: tax
- Sum: Turnover inc. VAT
Rows:
- One row per one tax type
Columns:
- Qunatity
- Qunatity %: Share of given tender type quantity in whole quantity
- Amount: Sales inc. VAT per tender type
Rows:
- One row per one tender type
Columns:
- Amount: Discount amount
- Quantity: quantity of items sold with given discount
- Total %: Share of given discount amount in all discounts amount
Rows:
- One row per one type of discount
Rows:
- Gross sale amount: Amount inc. VAT
Total%:
- Deposit refund: Deposit refound amount / Gross sale amount
- Returned items: Returned items amount/ Gross sale amount
- Deleted sales: Deleted amount/ Gross sale amount
- Deleted reciept: Deleted receipts amount/ Gross sale amount
- Scanned: Scanned quantity/ Gross sale qunatity


Description:
Report allows to follow up avg. member sales. Report divides sales data for months
Selections:
- Date - date to
- Loyalty program
Output:
Graphs show sales amount and sales quantity. Table is divided in to parts - amount and quantity
Columns:
- Amount inc. VAT
- Quantity
Source:
- Lindbak POS Reporting cube (OLAP)


Description:
Report allows to follow up avg. member sales. Report divides sales data for weeks
Selections:
- Date - date to
- Loyalty program
Output:
Graphs show sales amount and sales quantity. Table is divided in to parts - amount and quantity
Columns:
- Amount inc. VAT
- Quantity
Source:
- Lindbak POS Reporting cube (OLAP)


Description:
Report allows to follow up meber and member sale statistics divided by member age and member gender.
Selections:
- Date from - Default today
- Date to - Default today
- Retail store - Default all
- Loyalty program
Output:
Report is devided in 5 sections:
- Graph and table showing number of members who joined in the selected date range, compared to the number of members who joined the year before.
- Sales statistics divided between members and not member customers
- Graph and table showing sales amount by gender and age groups
- Sale statistics divided by member seniority level
- Sale amount grouped per department, divided by gender
Columns:
- Section 1
- This year - number of members who joined in the selected date range,
- Last year - number of members who joined the year before selected date range
- Section 2
- Num of receipts
- Avg amount - (Sale amount inc. VAT)/(Num of receipts)
- Items - number of items sold
- Items/Cust - average number of sold items per customer
- Gross profit
- Gross profit % - Share of Gross profit in Sale amount
- Section 3
- Age group
- Sales inc. VAT
- Gross profit
- Gross profit % - Share of Gross profit in Sale amount
- Section 4
- level - member characteristic
- Num of receipts
- Avg amount - (Sale amount inc. VAT)/(Num of receipts)
- Items - number of items sold
- Items/Cust - average number of sold items per customer
- Gross profit
- Gross profit % - Share of Gross profit in Sale amount
- Section 5
- Department - Department name
- Female - Sale amount inc. VAT for scpecific department generated by women
- Female % - Share of sale amount inc. VAT for scpecific department generated by women in all sales inc. VAT across all departments and all genders
- Total -Sale amount inc. VAT for scpecific department
- Total % - Share of sale amount inc. VAT for scpecific department in all sales inc. VAT across all departments
Sorting:
- Section 3 - Age group
- Section 4 - Level
- Section 5 - Department name
Clarifications:
- This year, las year - if date range is 2020/01/01 - 2022-/01/01, then This year is 2020/01/01 - 2022-/01/01 and Last year is 2019/01/01 - 2021/01/01
Source:
- Lindbak POS Reporting cube (OLAP)
- Lindbak POS Reporting DW

Description:
Report lists all member activities for selected member.
Selections:
- Loyalty program - Default: 0 - Default loyalty program
- Member number - Member key which needs to be written manually.
Output:
List of member activities and sales.
Columns:
- Activity - Activity number (default sorted on this column)
- Item name - Article name
- ID - Transaction ID + EAN number defining as Item ID
- Campaign - Campaign name + Campaign reference
- Description - description from member activity
- Date - End date time defining as transaction date from transaction article
- Amount - original face amount drom transaction article
- Discount - discount from transaction article
- Bonus points - Bonus amount
- Store - Store number + Store name
Clarifications:
- There is union all operator which combine values from different tables: FactRetailTransactionArticle article and FactMemberTransaction. It combines sales activity with bonus checks and points for the selected member.
Source:
- Lindbak POS Reporting DW

Description:
Created on request from product because funtion SALE_STAT in CR only gets data from Chain classic.
This report is optimized to run from Cash register with resolution set to 1024 * 768. Meant to use for cashiers to check sales statistics from today.
Selections:
- Date from - Default today
- Date to - Default today
- Retail store - Since this report is meant to run from cash register, parameter is hidden. When setting up repor in buttonconfig use "pRetailStore=[Retail Store].[Retail Store Num].&[@Storenum@]" in Parameter_1
Output:
Report is divided into two sections. First is showing graphical sale per hour. Second is showing sale statistics for cashiers.
Columns:
For seciton one. One row per cashier and one row for total on top.
- No - Cashier number
- Name - Cashier name
- Turnover - Sales inc. VAT
- Items - Number of items sold
- Customers - Number of customers / receipt
- Sale per customer - Average sale per customer / receipt
- Items per customer - Average items per customer / receipt
- Gr. prof % - Gross profit in percentage
Sorting:
- Sorting by cashier number
Clarifications:
- Not optimized for running in Chain Web, only Cash register.
Source:
- Lindbak POS Reporting cube (OLAP)

Description:
General report for item transaction. This report will show all item transactions with reason code.
Source:
- Lindbak POS Reporting cube ((OLAP) Item Transaction RealTime measure)
Selections:
- Date from - Default today
- Date to - Default today
- Store - Default All (if HQ user)
- Transaction type - Default All types. It is possible to removed transaction types from list with hidden parameter pTransactionTypesToExclude, see relevant parameters for details
- Reason code - Default all available codes. List shows only reasoncodes linked to selected transaction types. NB! Depending on Chain Web version. When you select transaction type, only first available reason code will be selected. Workaround for this is to de-select all reason codes before seleting transaction type(s).
- Absolute values - Default off. This will show all values as positive values. Used to get correct quantity when you have transactions with positive and negative values. Note that this will not affect sum of same item / reasoncode. Default selection can be changed in parameter pShowAbsoluteValues
- Grouping - Default Group. This will decide on which level of hierarchy report is generated. Report always shows item, it will also show total for group, area, department and store depending on selection. Default selection can be changed in parameter pGrouping
- Department - To filter result on department
- Article area - To filter result on article area
- Article group - To filter result on article group
Relevant parameters:
- pTransactionTypesToExclude - Comma separated list of transactions types not to show in list of transaction types. E.g. If customer never uses transaction type Aricle Service and Inventory, put in Normal,ArticleSerivce,Inventory in string (Normal shoul always be excluded)
- pShowAbsoluteValues - To change default value for 'Absolute values' selection
- pGrouping - To change default value for 'Grouping' selection
Output:
List of item transactions with reason code
Columns (sum for store and each level of hierarchy. Sum total on last row):
- EAN - EAN of item
- Item name - Item name
- Item number - Item number
- Transaction type - Transaction type
- Reason code - Reason code
- Date - Date of transaction
- Net price - Net price per unit
- Price w/VAT - Price including VAT per unit
- Quantity - quantity
- Net amount - Net amount (Net price * Quantity)
- Amount w/VAT - Amount including VAT (Price w/VAT * Quantity)
- GP% - Gross profit in percentage
Clarifications:
- Action code is not supported, only reason code (action code not available in Olap (reporting v77))
- Report shows only item transactions from poslog (no Rigal)
- Showing absolute values for same item / reasoncode is not possible (reporting v77). Report will always show sum of same item / reasoncode even if there are positive and negative values.
- Exampe:

- Without absolute values Report will show Quantity = -3 which is correct
- With absolute values report will show Quantity = 3, ideally it should split this into two lines
RTC-27768

Description:
Report lists all reasoncodes for all stores. Layout of the report makes it easy to export data to Excel.
Selections:
- Date from - Default today
- Date to - Default today
- Store - Default All (if HQ user)
- Transaction type - Default All types. It is possible to removed transaction types from list with hidden parameter pTransactionTypesToExclude, see relevant parameters for details
- Reason code - Default all available codes. List shows only reasoncodes linked to selected transaction types. NB! Depending on Chain Web version. When you select transaction type, only first available reason code will be selected. Workaround for this is to de-select all reason codes before seleting transaction type(s).
- Absolute values - Default off. This will show all values as positive values. Used to get correct quantity when you have transactions with positive and negative values. Note that this will not affect sum of same item / reasoncode. Default selection can be changed in parameter pShowAbsoluteValues
Relevant parameters:
- pTransactionTypesToExclude - Comma separated list of transactions types not to show in list of transaction types. E.g. If customer never uses transaction type Aricle Service and Inventory, put in Normal,ArticleSerivce,Inventory in string (Normal shoul always be excluded)
- pShowAbsoluteValues - To change default value for 'Absolute values' selection
- pGrouping - To change default value for 'Grouping' selection
Output:
List of item transactions with reason codes
Columns (interactive sorting on Storenum, Storename, Transaction type and Reason code):
- Store num - Store number
- Store name - Store name
- Transaction type - Transaction type
- Reason code - Reason code (default sorted on this column)
- Net cost - Total net cost (cost price) for row
- Quantity - Total quantity for row
- Net amount - Total amount without VAT for row
- Amount w / VAT - Total amount with VAT for row
- GP% - Gross profit in percentage
Clarifications:
- Action code is not supported, only reason code (action code not available in Olap (reporting v77))
- Report shows only item transactions from poslog (no Rigal)
- Showing absolute values for same item / reasoncode is not possible (reporting v77). Report will always show sum of same item / reasoncode even if there are positive and negative values.
- Exampe:
- Without absolute values Report will show Quantity = -3 which is correct
- With absolute values report will show Quantity = 3, ideally it should split this into two lines
CO-1904

Description:
Report lists credit sales for all stores in selected period time.
Selections:
- Date from – Default today
- Date to – Default today
- Show all credit sales – Default true
Output:
Report lists every sale in period time with name of customer, references and amount. Report sum up Amount and Tax amount.
Columns:
- Date – Sales date
- Dept. – Store number
- Receipt – Transaction id
- Customer – Customer name
- Ref. no – reference number
- Ref. text – reference text
- Amount
- Tax amount – VAT amount
Source:
- Lindbak POS Reporting DW

Description:
Report lists sales in department per store.
Selections:
- Date from – Default today
- Date to – Default today
- Store – Default all
- Department – Default all
Output:
Each department has own column. Report has a summary for each column except Total share. One store per row.
Columns:
- Store -Store number and store name
- Net amount
- Gr. prof % - Gross profit percentage
- Share – Share of net amount percentage
Clarifications:
Each new added department to report create new column in report table. Report table can be too large and may be divided into several pages.
Source:
- Lindbak POS Reporting Cube (OLAP)

Description:
Report shows sales per department and store
Selections:
- Date from- Default today
- Date to – Default today
- Store – Default all
- Price channels – Default all
Relevant parameters:
pHourFrom and pHoursTo are used to shows hours in column
Output:
- Report lists cash register frequence during all day with hours.
- Reports shows table for each selected store with summary on each column except column accumulated.
- There are two tables per one page.
Columns:
- Hour
- Number of workstations – Number of active workstations Amount
- Accumulated
- Share - Share of net amount percentage
- Customers
- Items
- Avg. sales customer – Average sales customer
- Price pr. Art. – Price per article
- Customers pricechannel
- Avg. sales per customer pricechannel – Average sales per customer pricechannel
- Turnover pricechannel
- Share pricechannel
Source:
- Lindbak POS Reporting Cube (OLAP)
Based on 0037 Report.

Description:
Report lists sales for selected store in period of time.
Selections:
- Date from – Default today
- Date to – Default today
- Store – Default all
Output:
Report lists sales for one row per store. Report sum up every column.
Columns:
- Store num. -Store number
- Store name
- Total Sales - Amount
- Sale ex. VAT – Net amount
- Tax amount
- Cost – Net cost
- Quantity
- Customers – Receipt count
- ATV – Average transaction value
- UPT – Units per transaction
- Gr. prof % - Gross profit percentage
- Gross profit
Sorting:
Interactive sorting on all except Sale ex. VAT, Tax amount, Cos and Gross profit
Source:
- Lindbak POS Reporting Cube (OLAP)
CO: 10400, PBI#90853

Description:
Report allow to follow up store settlement: all selected Chahiers (if all cashiers are selected it equals whole store settlement) and settlement per each Cashier on following pages.
Selections:
- Retail store – Single value; select a value from the list
- Operator – Defaul all
- Date from – Default today
- Date to – Default today
Subreports:
Columns:
- Currency
- Balance (Beholdning): Sales amount inc. VAT in main currency
- Balance local value: Sales amount inc. VAT in received currency
- Balance (Oppgjør): Money amount registered in the end of the day in given currency (sum for selected operators who made balance and selected days)
- Difference: Balance (Oppgjør) - Balance (Beholdning)
- Diff. local value: Balance (Money amount registered in the end of the day) in main currency - Balance local value
Coumns:
- Gross: Sales amount inc. VAT
- Net: Sales net amount
- VAT
Output:
One row per sum one type of VAT. Vaules are summed for given store, date period and operators
Description:
Sum of all transactions subtotal rounding (for given period, store and operators)
CO: 10625, PBI#116476

Description:
Report lists sales per store with comparison sales and difference.
Selections:
- Date from – Default first day of a current week
- Date to – Default today
- Compare date from - Default the same day of week as Date from year before
- Compare date to - Default the same day of week as Date to but year before
- Store – Default all
- Department – Default all
- Area- Deafult all
- Article group – Default all
- EAN list – Default empty
- Vendor – Default all
- Subvendor – Default all
Output:
Report lists sales in stores in selected period of time and comparison sales in other selected period of time with difference both sales. Report has a summary of each column.
Columns:
- Store – Store number and name
- Sales w/VAT – Sales amount with VAT
- Sales ex/VAT – Sales net amount excluding VAT
- Gross profit GP % - Gross profit percentage
Clarifications:
Negative values are colored red.
Source:
- Lindbak POS Reporting Cube (OLAP)
CO: 10603, PBI#116490

Description:
Report lists sales per department with comparison sales.
Selections:
- Date from – Default first day of a current week
- Date to – Default today
- Compare date from - Default the same day of week as Date from year before
- Compare date to - Default the same day of week as Date to but year before
- Department – Default all
- Store – Default all
- Include VAT – Default true
Output:
- Report shows sales per department for selected stores and period of time and comparison sales in other period of time.
- Report has a summary of each column.
- One page per store.
Columns:
- No – Department number
- Name – Department name
- Sales
- Gross profit GP % - Gross profit percentage
- Diff. sales – Difference sales
- Diff. Gross profit – Difference Gross profit
- Diff. GP % - Difference Gross profit percentage
- Sales amount – Share sales amount
- GP – Share gross profit
Sorting:
No – Department number (default sorting)
Clarifications:
Negative values are colored red.
Source:
- Lindbak POS Reporting Cube (OLAP)
CO: 10626, PBI#116469

Description:
Report lists sales per vendor with comparison sales.
Selections:
- Date from – Default first day of a current week
- Date to – Default today
- Compare date from - Default the same day of week as Date from year before
- Compare date to - Default the same day of week as Date to but year before
- Store – Default all Department – Default all
- Area – Default all
- Article group – Default all
- EAN list – Default empty
- Vendor – Default all
Output:
Report has a summary of each column. One page per store.
Columns:
- Vendor name – Vendor number and name
- Sales w/VAT – Sales amount with VAT
- Sales ex/VAT – Sales net amount excluding VAT
- Gross profit GP % - Gross profit percentage
Sorting:
Vendor No – Vendor number (default sorting)
Clarifications:
Negative values are colored red.
Source:
- Lindbak POS Reporting Cube (OLAP)
CO: 10626, PBI#116469

Description:
Report lists sales per vendor with comparison sales.
Selections:
- Date from – Default first day of a current week
- Date to – Default today
- Compare date from - Default the same day of week as Date from year before
- Compare date to - Default the same day of week as Date to but year before
- Store – Default all Department – Default all
- Area – Default all
- Article group – Default all
- EAN list – Default empty
- Subvendor – Default all
Output:
Report has a summary of each column. One page per store.
Columns:
- Subvendor – Subvendor number and name
- Sales w/VAT – Sales amount with VAT
- Sales ex/VAT – Sales net amount excluding VAT
- Gross profit GP % - Gross profit percentage
Clarifications:
Negative values are colored red.
Source:
- Lindbak POS Reporting Cube (OLAP)
CO: 115424

Description:
Report lists expiration dates of items including transaction type internal use with reason code.
Selections:
- Date From – Default today
- Date to – Default today
- Store – Default first avaible store
- Department – Default all
- Article area – Default all
- Article group – Default all
- Date type – Default all
- Shelf life date – Default today
- All shelf life dates – Default true
Columns:
- EAN Item name – Arcticle name
- Item number – Item id
- Cashier
- Date – End date time defining as transaction date
- Net price – Item price exluding VAT
- Price inc VAT – Item price including VAT
- Quantity
- Cost price - NetCost
- Amount
- Gross profit
- Expiration date – shelf life date
- Date type – shelf life date type
- Reason code
- Action code
Output:
Raport shows list of items for selected store and departments, and also for selected Article ares and groups. It is one row per EAN and present expiration date including transaction type internal use with reason code.
Clarifications:
- Report does not contain sum.
- Report is order by expiration date and department.
Source:
- Lindbak POS Reporting cube (OLAP)
- Lindbak POS Reporting DW
CO based on report 0714


Description:
Report allows to follow up article sales on multiple levels with possibility to select specific hourly intervals and exclude specific item groups.
Selections:
- Date from - Default today
- Date to - Default today
- Hour from - Default 0:00
- Hour to - Default 24:00
- Team - Default all
- Store - Default all
- Department - Default all
- Article area - Default all
- Article group - Default all
- Include VAT - Default on
- Exclude groups - Default false
- Excluded groups - Appears when Exclude groups is switched to true
Output:
Article sale statistics for selected stores, for selected date interval and for selected time interval grouped by department, area and group.
By default data is shown for department and it is possible to drill down to item level manually by clicng plus button or by using expand all button to expand everithing to item level at once.
Columns:
- Buttons for expanding and collapsing all drilldowns.
- EAN - EAN code
- Item name - Article name
- Quantity
- Total- Quantity sold
- Turnover inc. VAT or Turnover ex. VAT depending on selection.
- Total - Amount sold. Inc. or ex. VAT depending on selection
- Share - Share of this department / area / group / item related to total sale.
- Cost price - Cost price
- Gross profit
- Total - Gross profit amount
- Total % - Gross profit percentage.
Sorting:
- Department number
- Item Area number
- Item Group number
- EAN
Clarifications:
- Hour selection applies to each day in selected date period
Source:
- Lindbak POS Reporting cube (OLAP)
CO: 207212. Based on report 0754

Description:
Report allows to find given number of best or worst selling items on multiple levels (amount, quantity, gross profit) in two date intervals. Possible to select specific hourly interval.
Selections:
- Date from - Default today
- Date to - Default today
- Compare date from - Default the same day of week as Date from year before
- Compare date to- Default the same day of week as Date to but year before
- Hour from - Default 0:00
- Hour to - Default 24:00
- Team - Default all
- Store - Default all
- Department - Default all
- Article area - Default all
- Article group - Default all
- Number of items - Number of best or worst items to display - default 10
- Sort type - worst or best - report will display given number of worst or best selling items - default best
- Sort measure - amount/quantity/net cost/gross profit/gross profit % - set the measure on which the items are sorted. - default amount
- Vendor - default all
- Subvendor- default all
- Include VAT - Default on
- Exclude groups - Default false
- Excluded groups - Appears when Exclude groups is switched to true
Output:
Sale statistics for selected number of best or worst items per store sorted by selected sort measure devided in two selected date intervals in selected hour range.
Columns:
- Store
- Dept. - Department
- Area
- Grp. - Item group
- EAN
- Item name
- Quantity
- Turnover ex. VAT
- Gross profit
- Gross profit %
- Num of receipts
Sorting:
- Selected sort measure
Clarifications:
- Hour selection applies to each day in selected date period
- Negative values are colored red
Source:
- Lindbak POS Reporting cube (OLAP)
- Lindbak POS Reporting DW
CO: 208778. Based on report 0650

Description:
Report shows credit sales and payments on account to get a better overview over drive-offs.
Selections:
- Date from - Default today
- Date to - Default today
- Team - Default all
- Retail store - Default all available in selected team
Output:
One row per transaction grouped by store and customer. Page break and total for each store.
Columns:
- Date - date of the transaction,
- Receipt - receipt number of the transaction,
- Ref.no - reference number of the credit tender transaction,
- Ref.text - reference text of the credit tender transaction,
- Amount - amount inc. VAT of the credit tender transaction,
- Tax amount - VAT amount from articles,
- On account - payments when using payment on account function in POS.
Sorting:
- Store number
- Customer key
- Transaction date
Clarifications:
Transaction can be either Credit sale or Payment on account. If transaction is Payment on account there is no data available for columns: Ref.no and Ref.text
Source:
- Lindbak POS Reporting DW

Description:
Report lists top items sold in selected stores in period time.
Selections:
- Region – Default all
- Store – Default all
- Date from – Default today
- Date to – Default today
- Department – Default all
- Article Group – Default all
- Article Subgroup – Default all
- Vendor – Default all
- Top X – Number of rows, default set 10
Output:
Report shows top x items and item groups with their amount, gross profit and quantity in selected ranges. Report sum up all columns with numbers.
Columns:
- Item num. – Item number
- Item name – Article long name
- Item group – Group number and article group
- Vendor
- name Ex. VAT – Net amount
- Gross profit
- Gross profit % - Gross profit percentage
- Quantity
- Average price inc VAT – Average price including VAT
- Discount ex. VAT - Item discount excluding VAT
Clarifications:
If vendor name is not avaible return empty rows.
Source:
- Lindbak POS Reporting Cube (OLAP)

Description:
Report lists how often customer buys product in comparison to previous period time.
Selections:
- Date from – Default first day of a current week
- Date to – Default today
- Compare date from - Default year ago from today
- Compate date to - Default year ago from today
- Region – Default all
- Store – Default all
Output:
Report shows amount, number of customers and sold items for selected stores, regions and period time in comparison to previous selected period time. Raport presents percentage differences and sum up all columns for selected stores
Columns:
- Store – Store name
- Region- Team name
- Share – percentage net amount
- Ex. VAT – net amount
- Compared sales ex. VAT – Compared net amount
- Diff % - Percentage difference to compared date
- Customers num – Customer number
- Compared number of customers
- Diff % - Percentage difference to compared date
- Items per customer
- Compared items per customer
- Diff % - Percentage difference to compared date
- Avg. sales customer – Average sales customer
- Compared average sales per customer
- Diff % - Percentage difference to compared date
Clarifications:
Diff % is percentage difference (increase or decrease) between date and comparable date
Source:
- Lindbak POS Reporting Cube (OLAP)

Description:
Report lists sales per department and comparison sales in selected period of time.
Selections:
- Region – Default all
- Store – Default all
- Date from – Default today
- Date to – default today
- Compare date from - Default the same day of week as Date from year before
- Compare date to - Default the same day of week as Date to but year before
- Department – Default all
- Article group – Default all
- Article subgroup – Default all
- Vendor – Default all
Output:
- Report has a summary for each column for all selected departments.
- Summary totals in the beginning of new hierarchy level for:
- Department
- Article group
- Article subgroup
Columns:
- Buttons for expanding and collapsing all drilldowns
- Department – Department number and name
- Share Ex. VAT – Sales Excluding VAT
- Compared sales ex. VAT – Compared sales excluding VAT
- Diff % - Difference percentage between sales excluding VAT
- Gross profit amt. – Gross profit amount
- Compared gross profit
- Gross profit % - Gross profit percentage
- Compared gross profit % - Compared gross profit percentage
- Diff. gr. prof. %-units – Difference gross profit percentage in units
- Quantity
- Compared quantity
- Average sales per customer inc VAT – Average sales per customer including VAT
- Discount ex. VAT – Discount excluding VAT
- Activity result – Activity result between discount exc. VAT and exc. VAT
Source:
- Lindbak POS Reporting Cube (OLAP)

Description:
Report lists sales per assortment and comparison sales in selected period of time.
Selections:
- Region – Default all
- Store – Default all
- Date from – Default today
- Date to – default today
- Compare date from - Default the same day of week as Date from year before
- Compare date to - Default the same day of week as Date to but year before
- Department – Default all
- Article group – Default all
- Article subgroup – Default all
- Vendor – Default all
- Item number – Default empty
Output:
- Report has a summary for each column for all selected stores.
- Summary totals in the beginning of new hierarchy level for stores.
Columns:
- Buttons for expanding and collapsing all drilldowns
- Store – Store name
- Region – Region team Share Ex. VAT – Sales Excluding VAT
- Compared ex. VAT – Compared sales excluding VAT
- Diff % - Difference percentage between sales and compared sales
- Gross profit amt. – Gross profit amount Compared gross profit
- Gross profit % - Gross profit percentage
- Compared gross profit % - Compared gross profit percentage
- Diff gr. prof. %-units – Difference gross profit percentage in units
- Quantity
- Compared quantity
- Average sales per customer inc. VAT – Average sales per customer including VAT
- Compared average sales per customer inc. VAT – Compared average sales per customer including VAT
Source:
- Lindbak POS Reporting Cube (OLAP)
CO-99244, PBI#155899

Description:
Report lists members and e-mail/SMS subscriptions
Selections:
- Loyalty program – Default Loyalty program
- Store – Default all
Output:
Report shows members with e-mail/SMS subscriptions, one row per store with summary of each column.
Columns:
- Store – Store number and store name
- Members – Members quantity
- Email – Email quantity
- Mobile – Mobile quantity
Source:
- Lindbak POS Reporting DW

Description:
Report list shift statistic for selected stores and period time
Selections:
- Date from – Default today
- Date to – Default today
- Store – Default all
Relevant parameters:
- pDeletedStatuses - Comma separated list of statuses keys not to show in deleted receipts.
Output:
- Report shows shift statistic for each cashier with served customers, null sales and average amount for selected stores and period time.
- Report sum up customers, null sales, deleted amount, deleted quantity and average amount for each store.
Columns:
- Store – Store number and store name
- ShiftID
- Start – Shift start
- Stop – Shift end
- Cashier
- Customers – receipts count
- Nullsale – Total zero count
- Deleted amount – deleted receipts amount
- Deleted quantity – Deleted receipts quantity
- Avg amount – Average amount
Source:
- Lindbak POS Reporting Cube (OLAP)
Based on report 0107, but uses SQL instead of MDX

Descriptions:
Report lists loyalty club sales for selected stores depending on loyalty program and team.
Selections:
- Loyalty program – default 1
- Date from – Default today
- Date to – Default today
- Team – Default all
- Store – Default all
Relevant parameters:
- pCustomerGroupsEmployees – Customer group used for employees, default 1.
Output:
- One row per store.
- Raport show turnover, percentage of total sales, gross profit percentage and average quantity sold.
- Total sum of each column for selected stores.
Columns:
- No – Store number
- Store – Store name
- Turnover
- Total – total mount
- Not member – Amount without Loyalty program
- Member – Amount with Loyalty program
- Employess – Amount with Customer group
- % of total sales
- Not member – percentage members without Loyalty program
- Member – percentage members with Loyalty program
- Gross profit %
- Total – percentage total of gross profit
- Not member – percentage of gross profit for members without Loyalty program
- Member – percentage of gross profit for members with Loyalty program
- Employess – percentage of gross profitt for members with customer group
- Average quantity sold
- Total – quantity of articles per customers
- Not member - quantity of articles per customers without Customer club
- Member - quantity of articles per customers with Customer club
Clarifications:
Customer club refers to LoyaltyProgramKey and Employees refers to CustomerGroupKey. Gross profit is a value referred to NetCost deducted from NetAmount.
Source:
- Lindbak POS Reporting cube (OLAP)
- Lindbak POS Reporting DW
CO: 154926

Description:
Report lists cashiers statistics for selected stores.
Selections:
- Date from – Default today
- Date to – Default today
- Store – Default all
- Operator – Default operator
Output:
One page per store. Report has a summary for each column at the end each store's table.
Columns:
- Cashier No and Name – Cashier number and cashier name
- Returns quantity and amount
- Deleted receipts quantity and amount
- Deleted item lines quantity and amount
- Manual discounts quantity and amount
- Diff settlement amount – Difference settlement amount
- Deleted web order quantity and amount
- New customer orders quantity and amount
- Offline coupons quantity and amount
- Personnel disc. qty – Personnel discount quantity
Source:
- Lindbak POS Reporting Cube (OLAP)
RTC-27636 / CO-222611

Description:
Report shows information about issued, redeemed and balance for bonus checks, per month and store for the last 12 months.
Selections:
- Loyalty program - Default 1
- Team - Default all
- Store - Default all available in selected teams
Output:
One page per store. For each month sum of issued, redeemed, balance and expired bonus checks. One sum for manual issued checks, checks issued from sales and total. First page of report is total for all stores.
Columns:
- End of month - Shows last date in each month for the last 12 months.
- Bonus type - For each month there is one row for manual issues checks, checks issued from sales and total.
- Issued - Sum of bonus amount issued.
- Redeemed - Sum of redeemed bonus amount.
- Balance - Sum of not exipred, not used bonus amount.
- Expired Sum of bonus amount expired at the end of month.
Sorting:
- Month
Source:
- Lindbak POS Reporting DW

Description:
Report shows payments for invoices.
Selections:
- Store – Default number 100
- Date from – Default today
- Date to – Default today
Output:
Report lists invoice number, created date and amount for each customer for selected store and date range.
Columns:
- Customer num. – Customer number
- Customer – customer name
- Invoice no – Invoice number
- Date – Created date Amount
Source:
- Lindbak POS Reporting DW