How much greenhouse gas emissions does my energy use cause? The answer can be found in the report "Emissions".
Most energy production is associated with emissions of green house gases. The report "Emissions" helps your organisation keep track of the emissions of carbon dioxide equivalents (CO₂e) that are caused by your energy use. You also have the option to include uncategorized emission sources in the Mestro Portal.
This guide will:
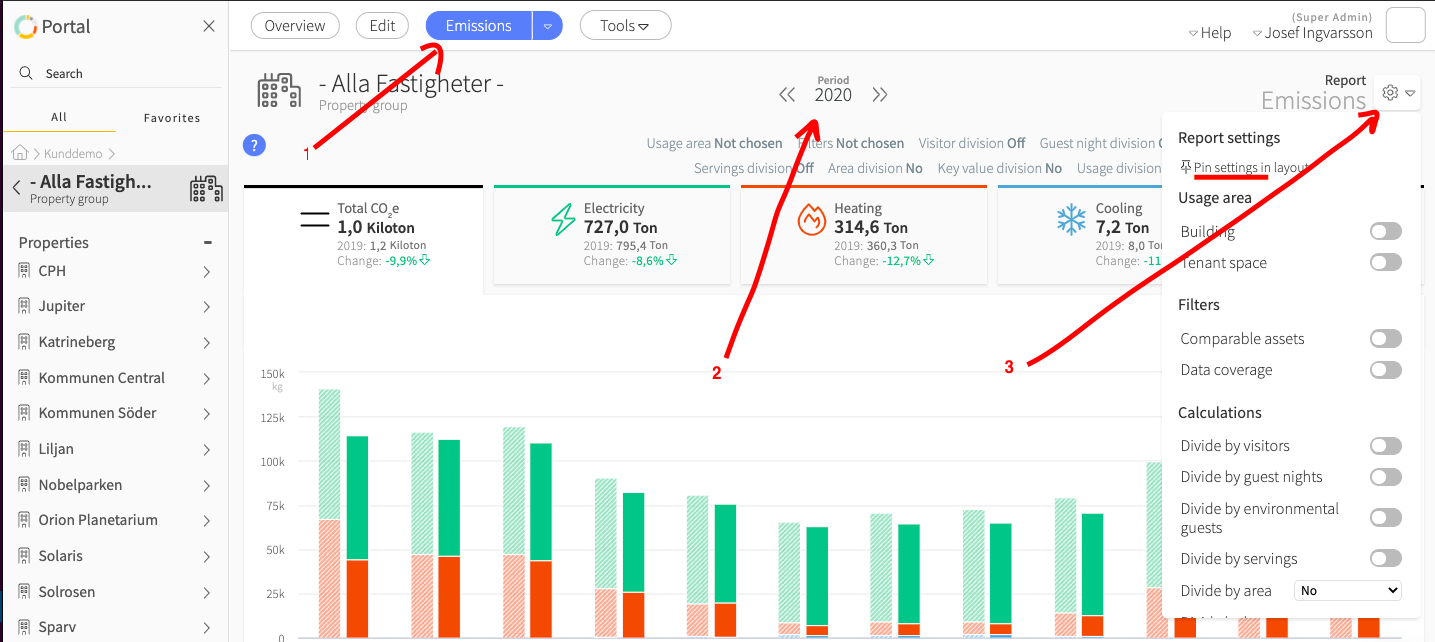
Make sure you are in the correct place in the node tree. Do you want to see the emissions of a property group, an individual building or your entire portfolio? Where you stand in the node tree will determine which emissions you see. Once certain that you are at the correct level in the node tree, click on the report "Emissions"
Do you want to see your emissions for a quarter, a month or a whole year? Select the period for the emissions you want to see by clicking on "period".
How do you want your emissions to be visualized? Use the report settings by clicking on the gear icon on the top right corner of the screen. I recommend that you also select "pin settings in layout" which will provide a smooth overview of what is actually shown in the report as different types of calculations and reference periods.
PRO TIP: The report will be extra useful if you fill in this information:
Area division: Make sure that all properties and buildings have the same areas filled in to be able to easily produce KPIs on emissions/square meter (CO₂e / m2). You do this in the edit mode for each property.
Usage Area: You can easily distinguish what emissions should be allocated to the tenant space vs common areas by using the toogle "buidling" and "tenant space". Please note that you have to tagg each meter with building vs. tenant in order for this functionality to work properly. Tagging is made on each specific meter in edit mode.
Review key figures and base years. Maybe you are interested in seeing emissions per apartment or heated volume for example? (this is being activated in the edit mode on the customer account).
Divide by usage - use this toggle in the report settings to see key figures on emissions/energy unit (CO₂e / kWh) in the report
The Emissions report always shows a bar chart and a data table. Each bar represents one month. The month bar on the far right shows the period you selected, while the slightly transparent bars show the data of the reference periods. In this way, you can see how the emissions impact has changed over a three-year period. A report that is even more suitable for analyzing trends is Trend Analysis.
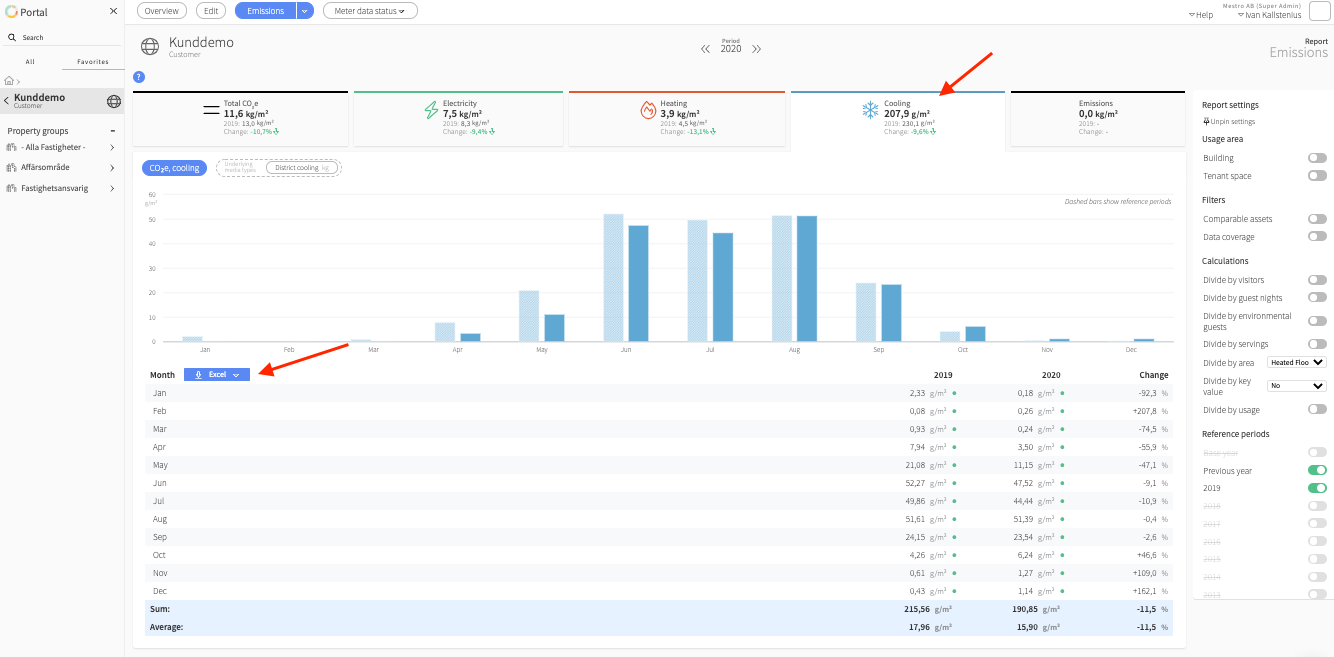
In the top left of the report you'll find the tab "Total CO₂e" where emissions for all types of energy are summed. You can easily export the data table with monthly values to excel or as a CSV-file by clicking on the blue button. You can also maneuver the report by clicking on e.g. Electricity or Heating tab. Then only bar charts for that type of use are visible. In the example below, we take a closer look at emissions for cooling:
The black tab on the far right summarizes other emissions, if you as a customer have chosen to register these in Mestro. These are emissions that do not originate from any standardized type of energy, transport or waste but can be a bit of anything, depending on what you want to measure.
You can see the emissions in relation to one or two reference years. To enable this, select the years of interest in the report settings. You can also choose to compare a specific year's emissions with a base year of your choice (you set the base year in Edit mode at customer level). The percentage change listed in the rightmost column references the previous year. In the example above, we compare 2020 to 2019 figures.
Missing some data in the report? It may be due to one of the following reasons:
You are trying to perform an area divison based on an area that is not registered for all your buildings in Mestro - turn off "divide by area" to see total emissions or select an area that you have registered for all selected properties.
You are missing the required energy data to calculate emissions. For example, having a broken cooling meter (or not have one at all) will prevent the system from calculating CO2e emissions for cooling usage.
You have not registered CO₂e-emission factors in Mestro. You can either use Mestro's standard emission factors or your own emission factors.
Bonus:
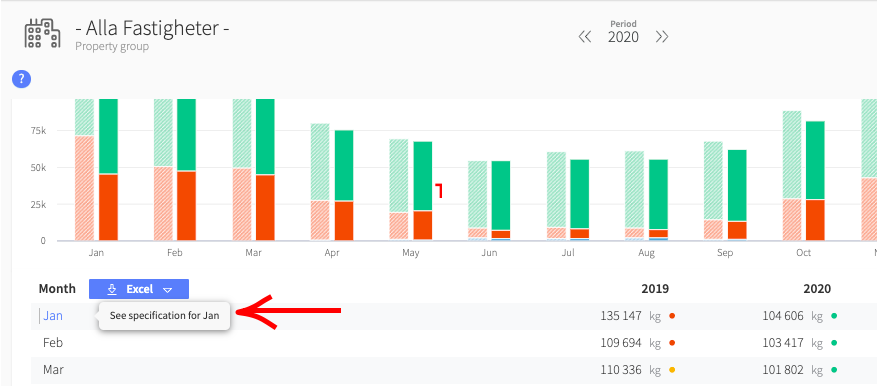
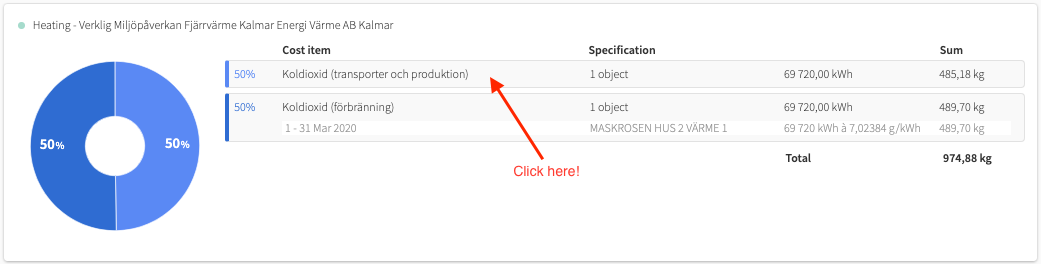
Do you want to know which emission factors actually form the basis for the emission calculations that you see in the report? Click on the small arrow to the right of the month in the table and then on the respective contract row. This lets you see both the emissions that are connected to the generation of energy (scope 2) and the production and transport of the fuel (scope 3).
Now that you have dived into your climate emissions, perhaps you are also interested in the costs associated with your energy use? Read more here about the report Cost.