We’re excited to introduce a set of updates designed to make it easier for you to stay informed, act faster, and work more efficiently in the Mestro platform. With this release, you’ll notice improvements to how alarms are displayed, a refreshed company logo, and clearer data insights.
We’re pleased to bring you our new Change Alarms this release! This functionality is a brand new Triggered Alarms experience that gives you instant visibility into alarms that need your attention.
What’s new?
We've added a new type of alarm, before we only had the threshold alarms and with this release we are introducing what we call change alarms.
Overview of what a change alarm is!
A Centralized Alarms Overview
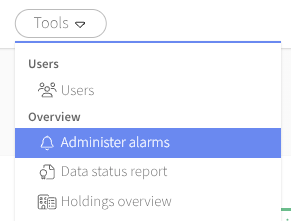
From now on, you administer your alarms from Tools in the top menu bar. See picture above.
This new tool provides a structured list of all triggered alarms.
You can view alarms:
For the specific node you’re currently working in, or
For the entire system
Each alarm includes key details such as name, object, severity, timestamps, and whether it has already been handled.
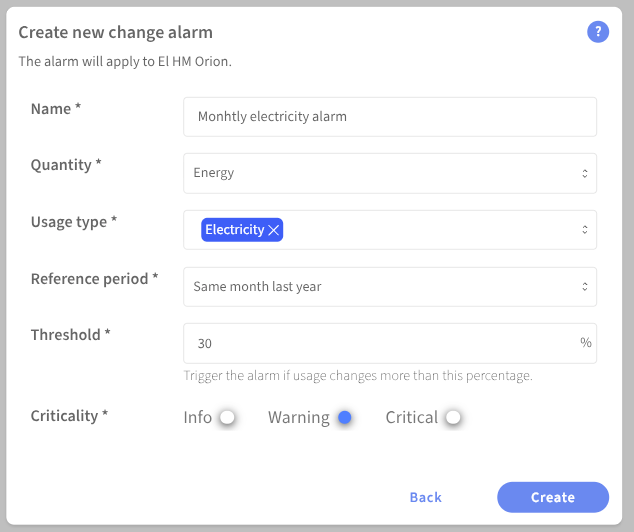
Create a new change alarm
To create a new change alarm, follow these steps
Search & Sorting for Faster Prioritization
Quickly search alarms by name or object, and sort them to focus on what matters most.
Handle Alarms Directly
Mark alarms as Handled or Unhandled without leaving the modal — updates happen instantly with clear confirmations.
For inactive nodes, previously triggered alarms can still be marked as handled, while moving them back to unhandled is disabled.
How You Benefit
Immediate awareness of important change alarms
Faster actions with in‑modal handling
Easier prioritization using search and sorting tools
Clear context whether you’re looking at a node or the full system
We’ve updated the portal to reflect Mestro’s refreshed brand identity.
Wherever the previous logo appeared, you will now see the new one — ensuring a more consistent and up‑to‑date visual experience.
This is a visual update only.
No changes to your workflow or functionality.
We’ve made several improvements to ensure your data views are as clear and reliable as possible.
Imporved data coverage calculations
Easier to read values in the Gap Filling tab
Improved display of NA values for monthly data