General
All the pages in the Optimaze.net Channel which shows information about company are called reports. Reports may divide to one to three columns and contain different kind of views.
Time selection
Time selection is located in the upper part of the report. You may select a year you wist to examine from the dropbox. Next to the year selection dropbox is a month selection dropbox where you may select a month and a quartal. In the example below, you see that selected year is 2017 and selected month is October. On the one month view on left you see only data of the selected month. On the other hand on the chart at the right side of the report you see always 12 months. This is because chart is configured to show aways at least a year.

Rolling-time selection
By selecting the use rolling time check box you may change the logic how the system selects which months to display. In the screeshot below you see that the user has selected October 2017 and ticked the rolling-time check box. Now look at the chart, instead of showing the year 2017 it shows now 12 months from November 2016 to October 2017.
The image below demonstrates how 12 month chart or report selects what to show for you if user has selected October 2017 and rolling time is not in use. Rolling-time affects only view with more than one month.

In the next image you can see how the selection changes when rolling time is ticked.

Organization selection
Organization may be changed from the menu in the far left side of the page. By default the system has selected your default organization for you. If your organization has suborganizations you may select any of them by clicking from the tree in the left. Selected organization appears highlighted in the tree and also its name appears in parenthesis next to reports title.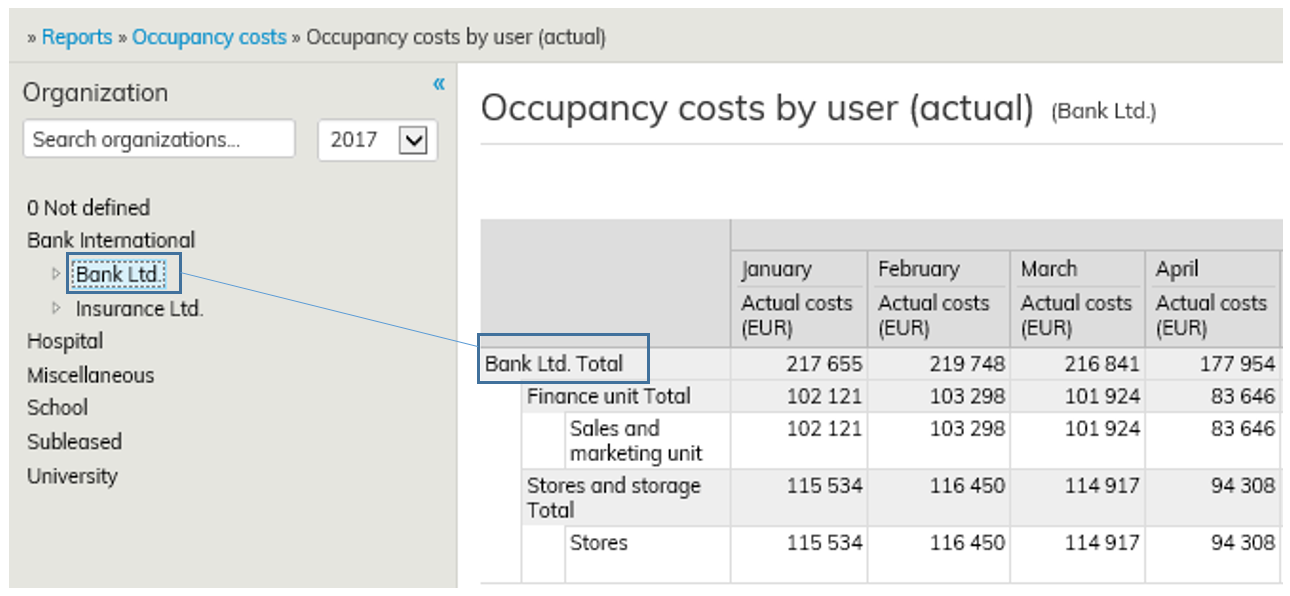
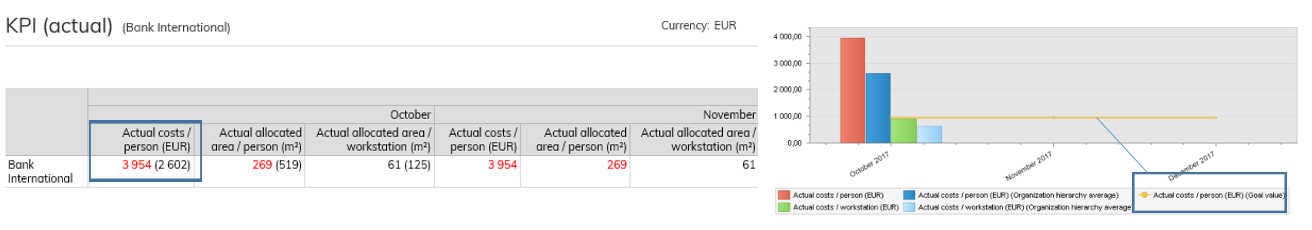
Goal values
Goal values are set by the companys management and them are ment to guide towards the goals of the company. Goal values are always company wide and cannot be set to any individual organization. All key performance indicators do not necessary have a goal value. From the image below you see that companys goal value has been exceeded in October 2017. In a chart goal values are shown as a horizontal line spanning through the whole chart and in tables goal value may be seen when moving cursor on top of KPI-value. When KPI-values are not met them are highlighted in red.
Organizations average
In some key performance indicator's organizations average may be shown next to the value for comparison. In the charts organization averages are shown as a new series.

Special views
Some views may contain special functionality. These special functions are always visible as icons on top right of the view.
Table
Table represents always numerical information of selected organization. Table is fully comparable with Excel's Pivot-tables. All the tables can be exported to excel by clicking icon. The table will be exported to excel just as it appears in the report. It is also possible to export report as a raw data to excel. This can be accomplished by clicking
 icon. Raw data may be used for more detailed analysis that is possible from the user interface.
Top 5 / Bottom 5
Top 5 / Bottom 5 is a special view which always shows the top or bottom five under the selected organization.
...