| Anchor | ||||
|---|---|---|---|---|
|
| Expand | ||
|---|---|---|
| ||
It is external simple extension to expand all reports below at once.
Thanks to this solution all report will expand at once after clicking bookmark. Now searching by CTRL+F is much simpler. |
| Anchor | ||||||
|---|---|---|---|---|---|---|
|
| Expand | ||
|---|---|---|
| ||
Standard Report Description:
Selections:
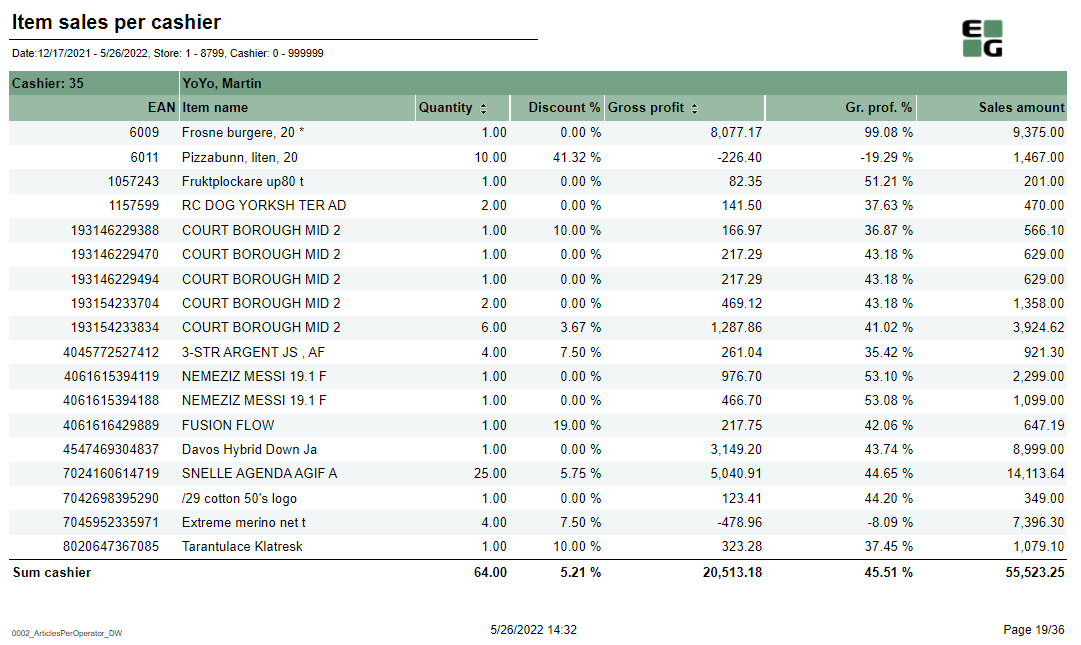
Output: Item sale statistics showed individually per each cashier (with number between Operator from and Operator to) per each stores (with number between Retail store from and Retail store to). Additionally there are totals for each cashier and each store. Columns:
Sorting:
Source:
|
| Anchor | ||||
|---|---|---|---|---|
|
| Expand | |||
|---|---|---|---|
| |||
Standard report Description:
Selections:
Output: Bonus checks usage and sales statistics grouped per store. Report lists all the stores in which checks were issued or redeemed. Columns:
Sorting:
Clarifications:
Source: Lindbak POS Reporting cube (OLAP) |
...
| Expand | ||
|---|---|---|
| ||
Description: Report allows to follow up meber and member sale statistics divided by member age and member gender. Selections:
Output: Report is devided in 5 sections:
Columns:
Sorting:
Clarifications:
Source:
|
...
Output: Item sale statistics showed individually per each cashier (with number between Operator from and Operator to) per each stores (with number between Retail store from and Retail store to). Additionally there are totals for each cashier and each store. Columns:
Sorting:
Source:
|
| Anchor | ||||
|---|---|---|---|---|
|
| Expand | ||
|---|---|---|
| ||
Standard report Description: Report is devided one page per store and shows cashiers sale statistics. On the last page there is summary for all selected stores. Selection:
Output:
Columns:
Sorting:
Source:
|
| Anchor | ||||
|---|---|---|---|---|
|
| Expand | ||
|---|---|---|
| ||
Standard report Description: Report is divided one page per store and shows cashiers sale statistics. On the last page there is summary for all selected stores. Selection:
Output:
Columns:
Sorting:
Source:
|
| Anchor | ||||
|---|---|---|---|---|
|
| Expand | ||
|---|---|---|
| ||
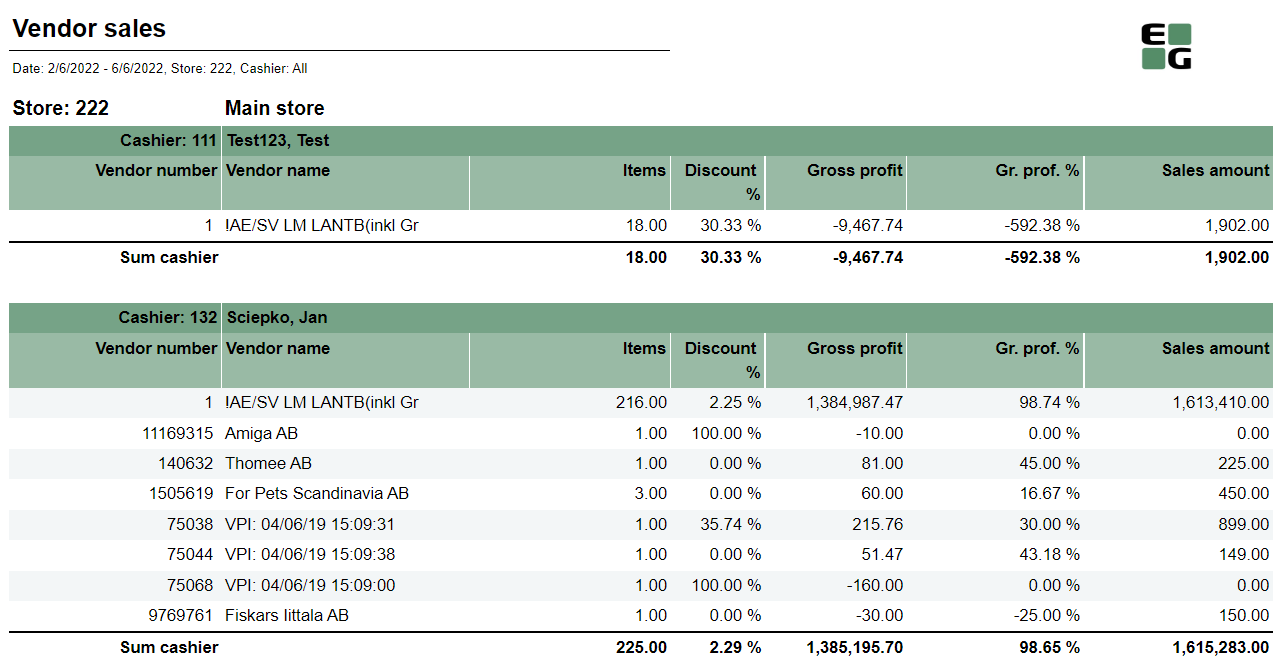
Standard report Description: Report allows to follow up sales statistics per cashier and per vendor (supplier). Report is devided sections per each selected cashier. Each section shows sales statistics per vendor. Selection:
Output:
Columns:
Source:
|
| Anchor | ||||
|---|---|---|---|---|
|
| Expand | ||
|---|---|---|
| ||
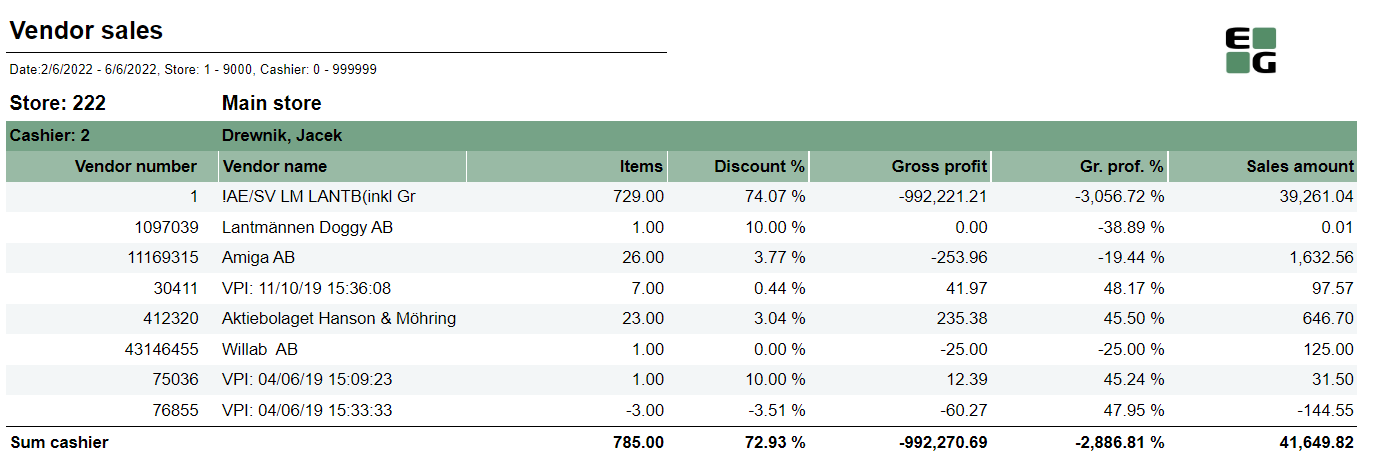
Standard report Description: Report allows to follow up sales statistics per cashier and per vendor (supplier). Report is divided sections per each selected cashier. Each section shows sales statistics per vendor. Selection:
Output:
Columns:
Source:
|
| Anchor | ||||
|---|---|---|---|---|
|
| Expand | ||
|---|---|---|
| ||
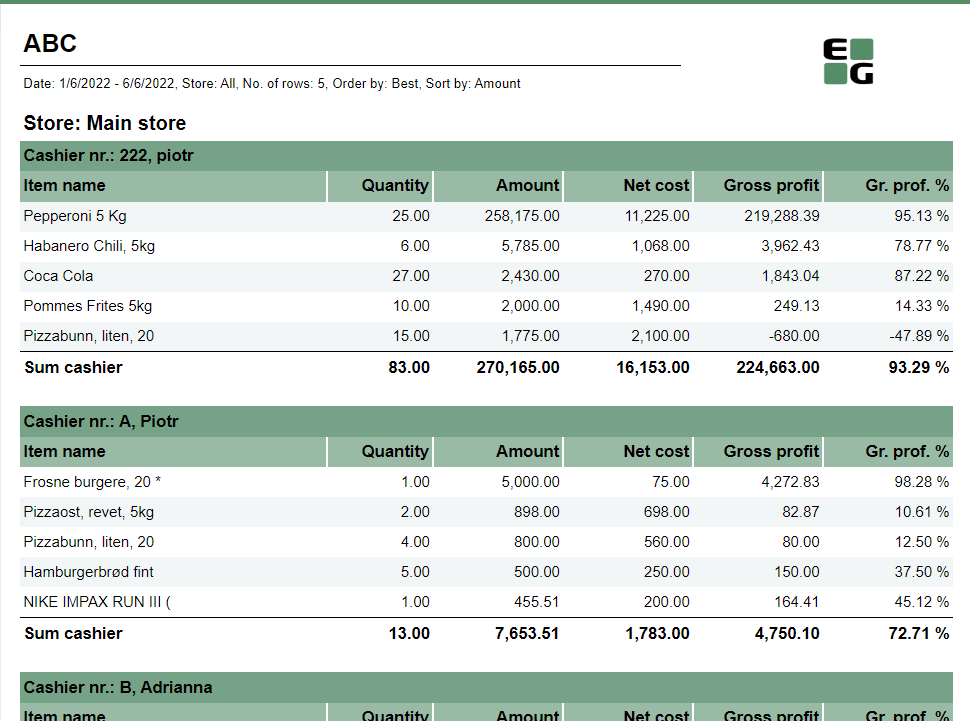
Standard report Description: Report allows to find given number of best or worst selling items per store, per cashier on multiple levels (amount, quantity, net cost, gross profit). Selections:
Output: One page per each store. One section per each cashier. Inside the section selected number of best (or worst) selling items for given cashier. Columns:
Sorting:
Source:
|
| Anchor | ||||
|---|---|---|---|---|
|
| Expand | ||
|---|---|---|
| ||
Standard report Description: Report allows to find given number of best or worst selling items on multiple levels (amount, quantity, gross profit, etc.) per selected hierarchy level (department,item area, etc.) Selections:
Output: Sale statistics for selected number of best or worst items per selected grouping (store or hierarchy level) sorted by selected sort measure with totals on higher levels (e.g. for grouping: article area there are totals for department and store, but for grouping: depratment there will be only total per store) Columns:
Sorting:
Clarifications:
Source:
|
| Anchor | ||||
|---|---|---|---|---|
|
| Expand | ||
|---|---|---|
| ||
Standard report Description: Report allows to comapare sales between two selected stores. Selections:
Output: Sales statistics per all item ierarchy levels (department, area, group, subgroup, item) expanded as selected in Statiscitcs parameter. Report is devoded in 3 sections:
Columns:
Sorting:
Clarifications:
Source:
|
| Anchor | ||||
|---|---|---|---|---|
|
| Expand | ||
|---|---|---|
| ||
Standard report Description: Report gives detailed sales statistics with campaign sales statistics included. Selections:
Output: Sale statistics for all items with not null sale amount narrowed down only by selections. One row per item. Totals in the begining of new hierarchy level for:
Columns:
Sorting:
Hidden parameters:
Source:
|
| Anchor | ||||
|---|---|---|---|---|
|
| Expand | ||
|---|---|---|
| ||
Standard report Description: Report gives detailed sales statistics with campaign sales statistics included with easier access to needed information than 0012. Selections:
Output: Sale statistics for all items with not null sale (or sale + nonsale if include nonsale box checked) amount narrowed down only by selections. One row per item. Totals in the begining of new hierarchy level for:
Columns:
Sorting:
Hidden parameters:
Source:
|
| Anchor | ||||
|---|---|---|---|---|
|
| Expand | ||
|---|---|---|
| ||
Standard report Description: Report gives detailed sales statistics with campaign sales statistics per article with grouping only per store. Selections:
Output: Sale statistics for all items with not null sale amount narrowed down only by selections. One row per item. One page per store. Columns:
Sorting:
Source:
|
| Anchor | ||||
|---|---|---|---|---|
|
| Expand | ||||||||||||||||||||||||||||||||||||||||||||||||||||||||||||
|---|---|---|---|---|---|---|---|---|---|---|---|---|---|---|---|---|---|---|---|---|---|---|---|---|---|---|---|---|---|---|---|---|---|---|---|---|---|---|---|---|---|---|---|---|---|---|---|---|---|---|---|---|---|---|---|---|---|---|---|---|
| ||||||||||||||||||||||||||||||||||||||||||||||||||||||||||||
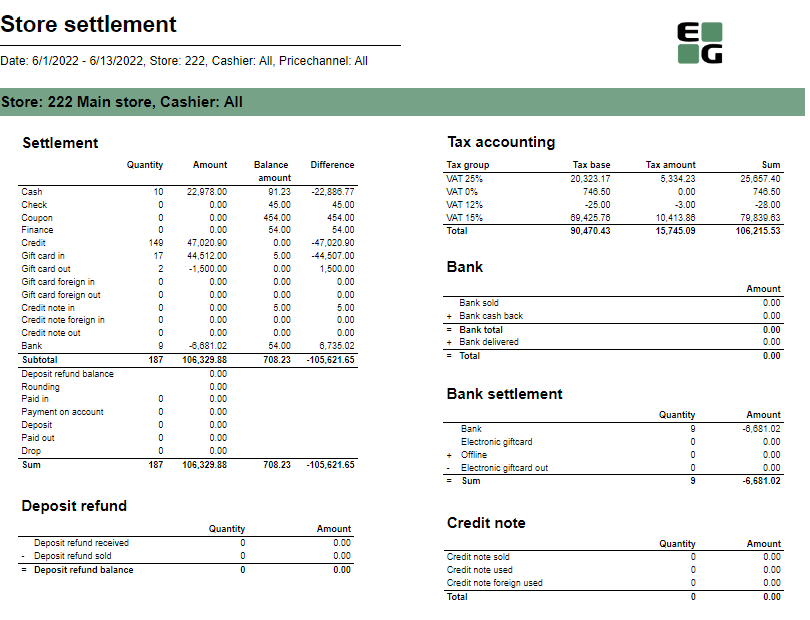
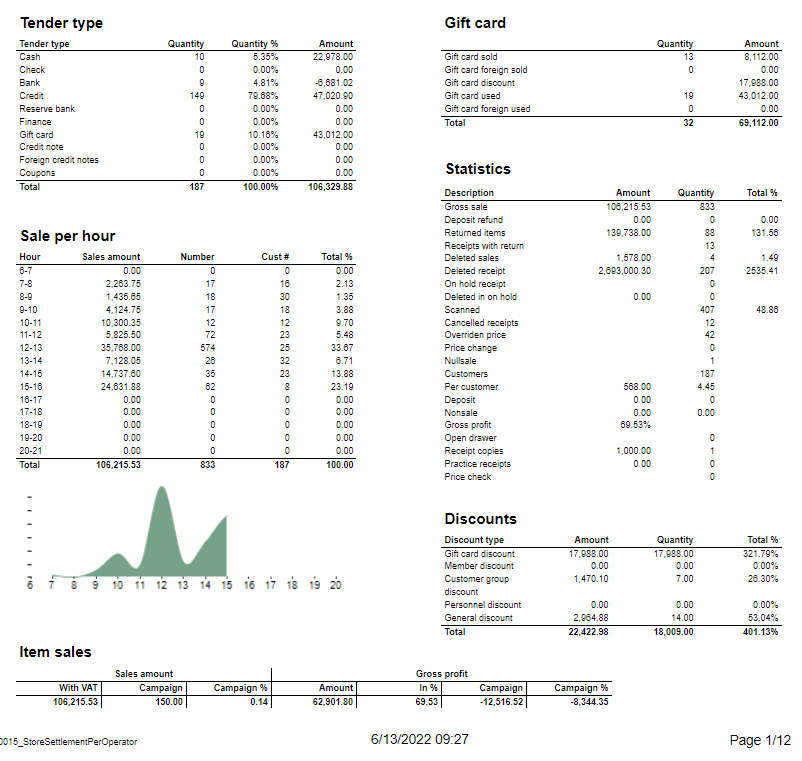
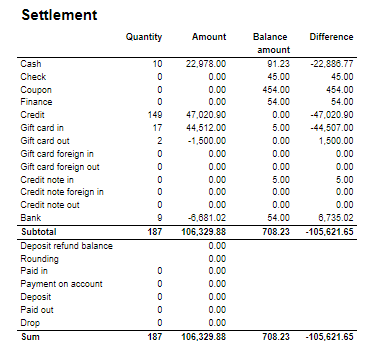
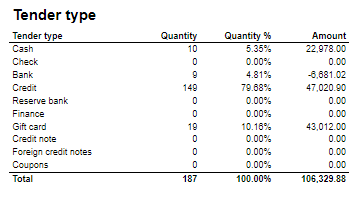
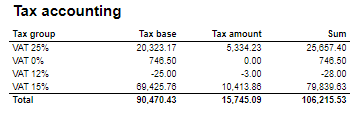
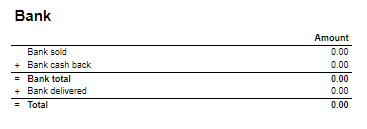
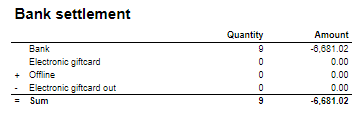
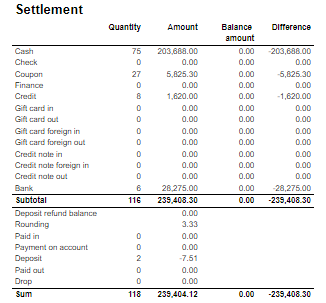
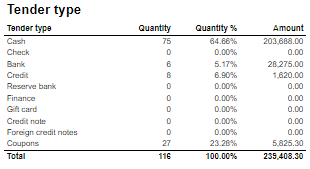
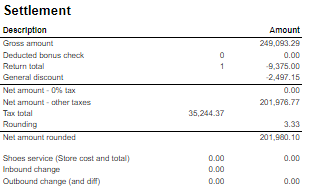
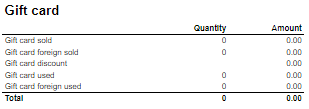
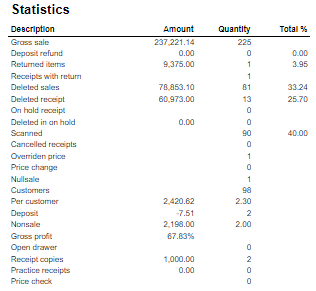
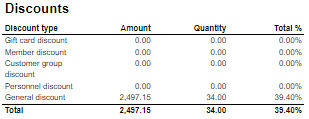
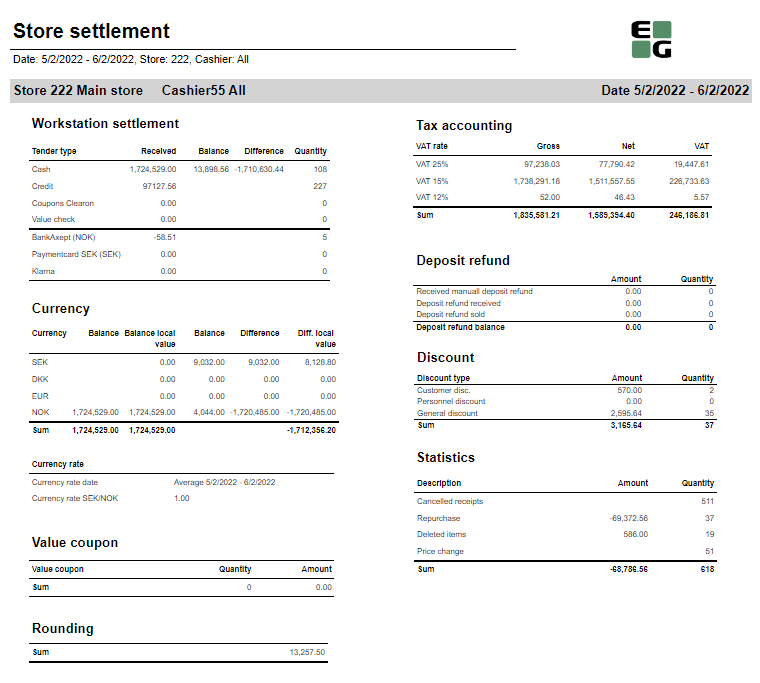
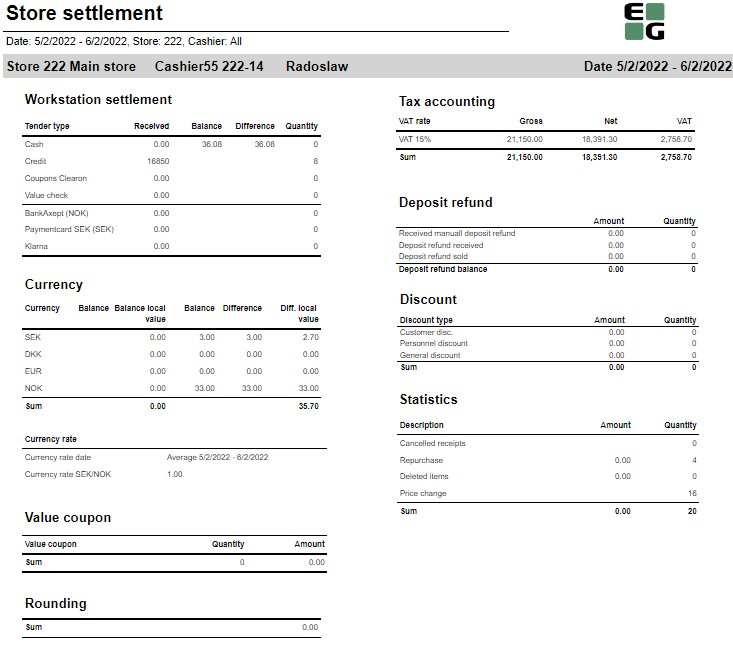
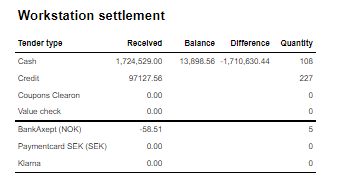
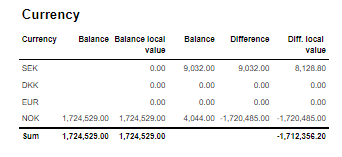
Standard report Description: Report allows to follow up store settlement: on first page settlement for all selected cashiers (if all cashiers are selected it equals whole store settlement) and settlement per each cashier on following pages. Report is divided in 12 subreports which will be descriped separatly below. Selections (applies to all subreports):
Subreports:
Source:
|
| Anchor | ||||
|---|---|---|---|---|
|
| Expand | |||||||||||||||||||||||||||||||||||||||||||||||||||||||||||||||||||||||||||
|---|---|---|---|---|---|---|---|---|---|---|---|---|---|---|---|---|---|---|---|---|---|---|---|---|---|---|---|---|---|---|---|---|---|---|---|---|---|---|---|---|---|---|---|---|---|---|---|---|---|---|---|---|---|---|---|---|---|---|---|---|---|---|---|---|---|---|---|---|---|---|---|---|---|---|---|
| |||||||||||||||||||||||||||||||||||||||||||||||||||||||||||||||||||||||||||
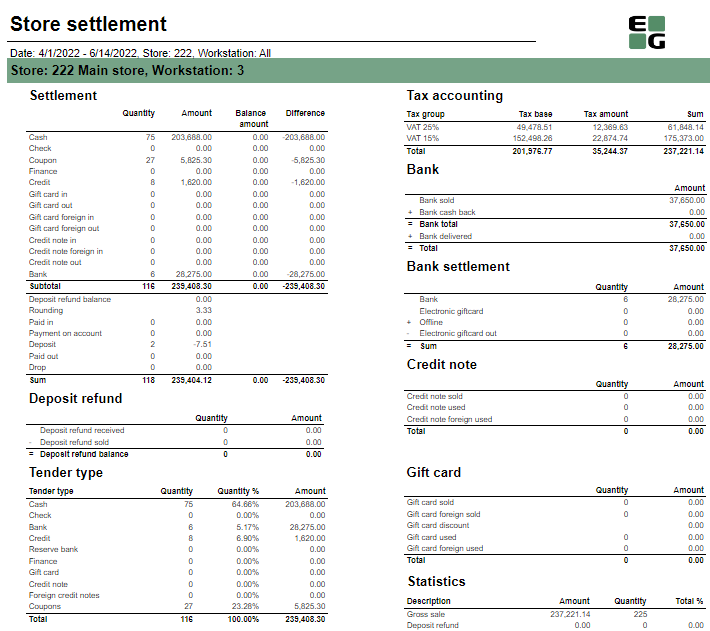
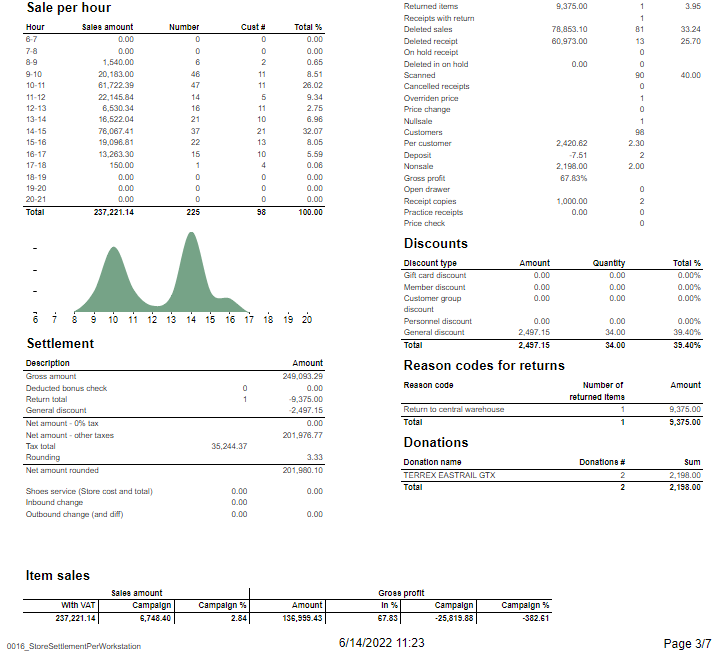
Description: Report allows to follow up store settlement: on first page settlement for all selected workstations and settlement per each workstation on following pages. Report is divided in 15 subreports which will be descriped separatly below. Selections (applies to all subreports):
Subreports:
Source:
|
| Anchor | ||||
|---|---|---|---|---|
|
| Expand | ||
|---|---|---|
| ||
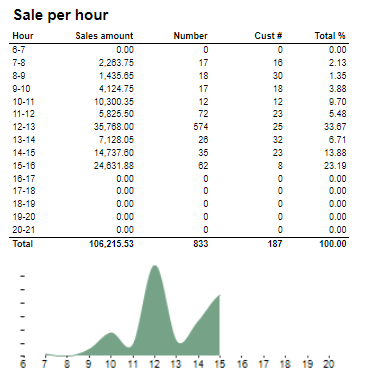
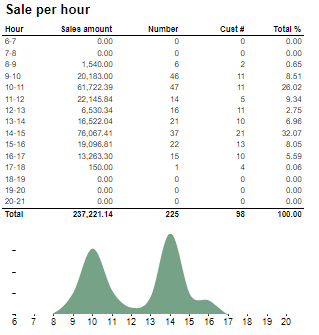
Standard report Description: Report lists sales per hour bar chart. Selections:
Relevant parameters: pHourFrom and pHourTo – use to set hours on x axis of bar chart. Output: X axis represents hours from 8 to 18. Y axis is sales amount. Columns (bars):
Source:
|
| Anchor | ||||
|---|---|---|---|---|
|
| Expand | ||
|---|---|---|
| ||
Standart report Description:
Selections:
Output: One page per store One row per cashier Columns:
Sorting:
Source:
|
| Anchor | ||||
|---|---|---|---|---|
|
| Expand | ||
|---|---|---|
| ||
Description:
Selections:
Output: One page per store One row per cashier Columns:
Sorting:
Source:
|
| Anchor | ||||
|---|---|---|---|---|
|
| Expand | ||
|---|---|---|
| ||
Description: Report lists each cashier sales in stores. Selections:
Output:
Columns:
Interactive sorting: Interactive sorting on all except Makeup % and Skincare %. Source:
|
| Anchor | ||||
|---|---|---|---|---|
|
| Expand | ||
|---|---|---|
| ||
Description: Report lists items, their quantity and amount for selected, specific values. Selections:
Output: Report shows bestsellers or worst sold items and their quantity and sum amount for selected store (one store per site) and period time. Columns:
Clarifications: Report can show counted number of products, Accumulation and can be measured by amount, quantity or gross profit. Source:
|
| Anchor | ||||
|---|---|---|---|---|
|
| Expand | ||
|---|---|---|
| ||
Description: Report lists sales per customer. Selections:
Output:
Columns: Customer number Number - Operator number Cashier - Cashier name Customer - Customer name Quantity Price pr. Art. - Price per article Disc. p. item - Discount per item Discount Discount % - Discount percentage Gross profit % - Gross profit percentage Hidden parametes:
Source:
|
| Anchor | ||||
|---|---|---|---|---|
|
| Expand | ||
|---|---|---|
| ||
Description: Report lists package sales. Selections:
Output: Packages grouped per store. One row per package. Report has a summary for each column (all stores and packages). Columns:
Interactive sorting: Everything except Cost, unit price and % of total Source:
|
| Anchor | ||||
|---|---|---|---|---|
|
| Expand | ||
|---|---|---|
| ||
Description: Report lists sales per weekday. Selections:
Output: Report shows 5 tables with sales per week: Company shops, CS Organic, Francise shops, Totalorganic and total. Each table has a summary at the end of table on each column for each type of store and last total table for all summaries. Columns:
Clarifications: Negative values are marked red. Source:
|
| Anchor | ||||
|---|---|---|---|---|
|
| Expand | ||
|---|---|---|
| ||
Description: Report lists sales per cashier in stores. Selections:
Output:
Columns:
Interactive sorting: Interactive sorting on all columns excepts Makeup %, Item list % and Gifts % Source:
|
| Anchor | ||||
|---|---|---|---|---|
|
| Expand | ||
|---|---|---|
| ||
Description: Report lists cashiers from stores and their sales. Selections:
Output:
Columns:
Interactive sorting: Everything except Makeup %, Item list%, Gifts % and Item group sales Source: Lindbak POS Reporting Cube (OLAP) |
| Anchor | ||||
|---|---|---|---|---|
|
| Expand | ||
|---|---|---|
| ||
Description: Report lists besteller items in stores. Selections:
Output: Report lists selected number of bestellers items including their quantity and amount in selected stores and period of time. Columns:
Source: Lindbak POS Reporting Cube (OLAP) |
| Anchor | ||||
|---|---|---|---|---|
|
| Expand | ||
|---|---|---|
| ||
Description: Report lists staff discount for employees. Selections:
Output: Summary totals in the beginning of new hierarchy level for Employees. Summary in the beginning of table for each column for all Employees. Columns:
Interactive sorting: Interactive sorting on all columns except Date, Item num. and Item name. Source:
|
| Anchor | ||||
|---|---|---|---|---|
|
| Expand | ||
|---|---|---|
| ||
Description: Report lists type of discounts in stores Selections:
Output: Summary totals at the end of new hierarchy level for stores. Columns:
Interactive sorting: Interactive sorting on Store num. and Store columns Source:
|
| Anchor | ||||
|---|---|---|---|---|
|
| Expand | ||
|---|---|---|
| ||
Description: Report lists discounts of items in stores. Selections:
Output:
Columns:
Interactive sorting:
Source: Lindbak POS Reporting Cube (OLAP) |
| Anchor | ||||
|---|---|---|---|---|
|
| Expand | ||
|---|---|---|
| ||
Description: Report lists inventory adjustments in stores. Selections:
Output:
Columns:
Clarifications: Item Transactions are used, filtering based on Reason Codes dim. Source:
|
| Anchor | ||||
|---|---|---|---|---|
|
| Expand | ||
|---|---|---|
| ||
Description: Report lists cashiers turnovers at a particular day. Selections:
Output: Report is presented as file to csv export without any colors. Columns:
Source:
|
| Anchor | ||||
|---|---|---|---|---|
|
| Expand | ||
|---|---|---|
| ||
Description: Report lists stores turnovers at a particular day. Selections:
Output: Report is presented as file to csv exportwithout any colors. Columns:
Source: Lindbak POS Reporting Cube (OLAP) |
| Anchor | ||||
|---|---|---|---|---|
|
| Expand | ||
|---|---|---|
| ||
Description: Report lists cashiers turnovers on a particular day per receipt. Selections:
Output: Report is presented as file to csv exportwithout any colors. Columns:
Source:
|
| Anchor | ||||
|---|---|---|---|---|
|
| Expand | ||
|---|---|---|
| ||
Description: Report lists sales statistics with drilldown. Selections:
Output:
Columns:
Source:
|
| Anchor | ||||
|---|---|---|---|---|
|
| Expand | ||
|---|---|---|
| ||
Description: Report lists sales table by cashiers for each store and summary sales table by stores. Selections:
Output:
Columns:
Interactive sorting: Interactive sorting on Cashier name, Number and Gross. Source:
|
| Anchor | ||||
|---|---|---|---|---|
|
| Expand | ||
|---|---|---|
| ||
Description: Report lists sales for selected storse in selected period of time. Selections:
Output:
Columns:
Interactive sorting: Interactive sorting on all except Makeup %. Source: Lindbak POS Reporting Cube (OLAP) |
| Anchor | ||||
|---|---|---|---|---|
|
| Expand | ||
|---|---|---|
| ||
Description: Report lists sales per week. Selections:
Output: Report shows 5 tables with sales per week: Company shops, CS Organic, Francise shops, Totalorganic and total. Each table has a summary at the end of table on each column for each type of store and last total table for all summaries. Columns:
Source:
|
| Anchor | ||||
|---|---|---|---|---|
|
| Expand | ||
|---|---|---|
| ||
Description: Report lists average sales per customer. Selections:
Output: Values are shown in thousands. Report has a summary on each column for all stores, for stores in each team and total summary on the end of table. Columns:
Source:
|
| Anchor | ||||
|---|---|---|---|---|
|
| Expand | ||
|---|---|---|
| ||
Description: Report lists bestseller products in each store. Selections:
Output: Report lists bestseller items with quantity and gross profit for seleected period of time for each selected store, one page per store. Columns:
Source: Lindbak POS Reporting Cube (OLAP) |
| Anchor | ||||
|---|---|---|---|---|
|
| Expand | ||
|---|---|---|
| ||
Description: Report lists campaign sales statistics. Selections:
Output:
Columns:
Source:
|
| Anchor | ||||
|---|---|---|---|---|
|
| Expand | ||
|---|---|---|
| ||
Description: Report lists mixmatch list of articles for stores. Selections:
Relevant parameters:
Output: Report shows total summary on each column at the end of the table. Columns:
Source:
|
| Anchor | ||||
|---|---|---|---|---|
|
| Expand | ||
|---|---|---|
| ||
Description: Report lists sales per product group as a difference report per week. Selections:
Output:
Columns:
Source:
|
| Anchor | ||||
|---|---|---|---|---|
|
| Expand | ||
|---|---|---|
| ||
Description: Report lists sales per product group as a difference report per week Selections:
Output: Report shows list of items in selected stores and their sales per week and per year with last year comparison. Report has a summary on each column on the end of report table. Columns:
Source:
|
| Anchor | ||||
|---|---|---|---|---|
|
| Expand | ||
|---|---|---|
| ||
Description: Report lists number of sales every quarter for each store and total number of sales for all stores. Selections:
Output:
Columns:
Clarifications: All used values in report are selected for: not deleted Status, stock type article and for regular sales. Source:
|
| Anchor | ||||
|---|---|---|---|---|
|
| Expand | ||
|---|---|---|
| ||
Description: Report lists sales per store with differnce report per day Selections:
Output: Report shows sales for selected stores with summary for all teams and each team seperately. Report has a total summary on the end of each column. Columns:
Source:
|
| Anchor | ||||
|---|---|---|---|---|
|
| Expand | ||
|---|---|---|
| ||
Description: Report lists sales per store with differnce report per day Selections:
Output:
Columns:
Source:
|
| Anchor | ||||
|---|---|---|---|---|
|
| Expand | ||
|---|---|---|
| ||
Description: Report lists sales per store as a difference report per month. Selections:
Output: Report has a summary totals on each column on the end of the report. Report is divided on selected teams, and at the beginning of report, to all teams. Selected teams have total summaries rows for columns and total compared summaries. Columns:
Source:
|
| Anchor | ||||
|---|---|---|---|---|
|
| Expand | ||
|---|---|---|
| ||
Description: Report lists sales per store with difference per month. Selections:
Output:
Columns:
Source:
|
| Anchor | ||||
|---|---|---|---|---|
|
| Expand | ||
|---|---|---|
| ||
Description: Report lists sales per store with difference per week. Selections:
Output: Values are shown in thousands. Report has a summary for all stores and for stores in each team. Report has also total summary on the end of table. Columns:
Source:
|
| Anchor | ||||
|---|---|---|---|---|
|
| Expand | ||
|---|---|---|
| ||
Description: Report lists sales per store with difference per week. Selections:
Output:
Columns:
Clarifications: Item name is marked red. Source:
|
| Anchor | ||||
|---|---|---|---|---|
|
| Expand | ||
|---|---|---|
| ||
Description: Report lists mix sales for articles in a particular store. Selections:
Output: Report has a mix sales summary at the end of report. Columns:
Source:
|
| Anchor | ||||
|---|---|---|---|---|
|
| Expand | ||
|---|---|---|
| ||
CO-1069 Description: Report lists sales per store including VAT with difference report per day. Selections:
Output: Report shows sales for selected stores with summary for all teams and each team seperately together with compared total. Report has a summary on the end of each column. Columns:
Source:
|
| Anchor | ||||
|---|---|---|---|---|
|
| Expand | ||
|---|---|---|
| ||
Description: Report lists sales per store with difference report per month. Selections:
Output: Report has a summary totals on each column on the end of the report. Report is divided on selected teams, and at the beginning of report, to all teams. Selected teams have total summaries rows for columns and total compared summaries. Columns:
Clarifications: Identical to report 0049, but with date from-to instead of year and month. Source:
|
| Anchor | ||||
|---|---|---|---|---|
|
| Expand | ||
|---|---|---|
| ||
Description: Report lists sales per month for each store and comparison month from last year. Selections:
Output:
Columns:
Source:
|
| Anchor | ||||
|---|---|---|---|---|
|
| Expand | ||
|---|---|---|
| ||
CO attached to PBI #12200 Description:
Selections:
Output: One row per item showing quantity of nonsale transaction on given item. Total per each cashier and per each store. Columns:
Sorting:
Source:
|
| Anchor | ||||
|---|---|---|---|---|
|
| Expand | ||
|---|---|---|
| ||
PBI: 12060, IN94 Description: Report lists amount and quantity of different discounts made by cashiers. Selections:
Output:
Columns:
Source:
|
| Anchor | ||||
|---|---|---|---|---|
|
| Expand | ||
|---|---|---|
| ||
PBI: 39373 Description: Report lists cashier statistics. Selections:
Output:
Columns:
Source:
|
| Anchor | ||||
|---|---|---|---|---|
|
| Expand | ||
|---|---|---|
| ||
CO: 1043 Description: Report lists bestseller items by sales in a store. Selections:
Output: Report shows three tables: 10 best items, Best 10 items in my store and Best 5 stores in country. The table best 5 stores in my country is divided on other tables: Best 5 stores in my team, best 5 stores compared to last year % and best 5 stores compared to last year. Report has also gauge panel with number of customer in this week and last year. Columns:
Clarifcations: % of total column has blue bars inside of rows to present percentage amount of total item sales. Source:
|
| Anchor | ||||
|---|---|---|---|---|
|
| Expand | ||
|---|---|---|
| ||
CO: 1044 Description: Report lists detailed information about Breakage and complaint items. Its quantity, amount, breakage and compplaint by team and store and grouped by worst registered items. Selections:
Output: Report is devided in 6 sections:
Columns:
Clarifications: Chart from section 3 is presented as list in section 4 and chart from section 5 is presented as list in section 6. Source:
|
| Anchor | ||||
|---|---|---|---|---|
|
| Expand | ||
|---|---|---|
| ||
CO: 1045 Descriptions: Report lists dashboard about sales in cashregister per store. Selections:
Output: Report shows three tables:
Columns:
Source:
|
| Anchor | ||||
|---|---|---|---|---|
|
| Expand | ||
|---|---|---|
| ||
CO: 1047 Description: Report lists week sales statistics for all stores. Selections:
Output: Report has a summary at the end of each column. Columns:
Interactive sorting: Interactive sorting on columns: Difference budget %, Difference sales %, Average diff. and Customers diff%. Source:
|
| Anchor | ||||
|---|---|---|---|---|
|
| Expand | ||
|---|---|---|
| ||
CO: 1048 Description: Report lists sales statistics for teams and stores seperately. Selections:
Output: Report shows two tables. First table has a list of teams and summary row for all teams, second table shows list of stores and has summary at the end of each column. Columns:
Source:
|
| Anchor | ||||
|---|---|---|---|---|
|
| Expand | ||
|---|---|---|
| ||
CO: 1046
Description: Report lists bestseller items. Selections:
Output: Report shows bestseller items in teams and in stores in tw otables. Report has a total summaries for both tables at the end of each column. Columns:
Source:
|
| Anchor | ||||
|---|---|---|---|---|
|
| Expand | ||
|---|---|---|
| ||
CO: 1137 Descriptions: Report lists dashboard about sales in cashregister per team. Selections:
Output: Report shows three tables:
Columns:
Source:
|
| Anchor | ||||
|---|---|---|---|---|
|
| Expand | ||
|---|---|---|
| ||
CO-1135 Description: Report lists month sales statistics. Selections:
Output: Report shows two tables, first one shows sales statistics for all teams, second sales statistics for stores. Report has a summary totals at the end of the second table on each column. Columns:
Interactive sorting: Interactive sorting on columns: Difference budget %, Difference sales %, Average diff. and Customers diff%. Source:
|
| Anchor | ||||
|---|---|---|---|---|
|
| Expand | ||
|---|---|---|
| ||
CO - 1207
Description: Report lists average sales for teams and stores. Selections:
Output: Report shows two tables, first for all teams, second for stores in these teams. Report has a summary on the end of the each column. Columns:
Source:
|
| Anchor | ||||
|---|---|---|---|---|
|
| Expand | ||
|---|---|---|
| ||
Description: Report lists promotion item sales. Selections:
Output: Report has a table with number of product lines per receipts with total summary at the end of each column. Report has also chart with amount of number of receipts and net amount. Report has a short table with sales statistics and column with share of total sales at the end of report. Columns:
Source:
|
| Anchor | ||||
|---|---|---|---|---|
|
| Expand | ||
|---|---|---|
| ||
Description: Report lists basktet analysis Selections:
Output: Report has a total summarty at the end of report on each column. Columns:
Interactive sorting: Interactive sorting on each column. Source:
|
| Anchor | ||||
|---|---|---|---|---|
|
| Expand | ||
|---|---|---|
| ||
Description: Report lists security statistics of cashiers in stores. Selections:
Output: Report shows statistics of cashiers after expanding stores. Summary totals in the beginning of new hierarchy level for Store. Columns:
Interactive Sorting: Interactive sorting on all columns except deleted unifinished receipts and deleted receipts amount. Clarifications: Report has two buttons to expand and collapse all stores. Source:
|
| Anchor | ||||
|---|---|---|---|---|
|
| Expand | ||
|---|---|---|
| ||
Description: Report lists data for floor planning system. Selections:
Output: Report shows sales data for floorplanning. Columns:
Source:
|
| Anchor | ||||
|---|---|---|---|---|
|
| Expand | ||
|---|---|---|
| ||
Description: Report lists daily total net amount for a store. Selections:
Output: One page per store. Each table has a summary of each column. Columns:
Interactive sorting: Interactive sorting on all columns Source:
|
| Anchor | ||||
|---|---|---|---|---|
|
| Expand | ||
|---|---|---|
| ||
Description: Report lists sale per cashier in each store. Selections:
Output: Report shows quantity and amount of sales for each cahier in selected store. There is a summary for each column. One page per store Columns:
Source:
|
| Anchor | ||||
|---|---|---|---|---|
|
| Expand | ||
|---|---|---|
| ||
Description: Report lists item group sales. Selections:
Output: Report lists item group quantity and amount for selected stores, one page per store. There is a summary for each column. Columns:
Interactive sorting: Interactive sorting on all columns Source:
|
| Anchor | ||||
|---|---|---|---|---|
|
| Expand | ||
|---|---|---|
| ||
Description: Report lists items pick in selected store and workstation. Selections:
Output: Report shows items in items group for selected store and workstations. Columns:
Source:
|
| Anchor | ||||
|---|---|---|---|---|
|
| Expand | ||||||||||||||||||||||||||||||
|---|---|---|---|---|---|---|---|---|---|---|---|---|---|---|---|---|---|---|---|---|---|---|---|---|---|---|---|---|---|---|
| ||||||||||||||||||||||||||||||
Description: Report allows to follow up store settlement: on first page settlement for all selected workstations and settlement per each workstation on following pages. Report is divided in subreports wchich will be described separatly. Selections (applies to all subreports):
Output: One page per workstation. First page with report table contains all workstations. Subreports:
Source: Lindbak POS Reporting Cube (OLAP) |
| Anchor | ||||
|---|---|---|---|---|
|
| Expand | ||
|---|---|---|
| ||
CO: 190361, RTC-16608 Description: Report lists number of members with and without bonus points and pie chart. Selections:
Output: Report shows number of members with and without bonus points and pie chart which related to table. Columns:
Source:
|
| Anchor | ||||
|---|---|---|---|---|
|
| Expand | ||
|---|---|---|
| ||
CO190338, RTC-16610 Description: Report lists bonus rollout statistics. Selections:
Output: Report shows statistics about bonus rollout. Report has a table and a redeemed by check value chart. Columns:
Source:
|
| Anchor | ||||
|---|---|---|---|---|
|
| Expand | ||
|---|---|---|
| ||
RTC-16609 Description: Report lists bonus rollout redeemed percetange chart. Selections:
Output:
Source:
|
| Anchor | ||||
|---|---|---|---|---|
|
| Expand | ||
|---|---|---|
| ||
CO: 190338 Description: Report allows to follow up bonus rollout checks usage and sales made using bonus checks. Selections:
Output: Bonus checks usage and sales statistics grouped per store. Report lists all the stores in which checks were issued or redeemed. Columns:
Sorting:
Clarifications:
Source:
|
| Anchor | ||||
|---|---|---|---|---|
|
| Expand | ||
|---|---|---|
| ||
Description: Report lists weekly sales statistics with last year comparison. Selections:
Output: Report shows stores sales statistics with less and more than 1 year of operation. Report has a summary for for stores with less than 1 year operation and total summary for all stores at the end of each column. Columns:
Source:
|
| Anchor | ||||
|---|---|---|---|---|
|
| Expand | ||
|---|---|---|
| ||
Description: Report lists month sales statistics with comparison so far to this year. Selections:
Output:
Columns:
Source:
|
| Anchor | ||||
|---|---|---|---|---|
|
| Expand | ||
|---|---|---|
| ||
Description: Report lists sales per hour and per department for selected two dates. Selections:
Output:
Columns:
Source:
|
| Anchor | ||||
|---|---|---|---|---|
|
| Expand | ||
|---|---|---|
| ||
Description: Report lists total sales for selected stores in selected period of time. Selections:
Output: Report shows total sales statistics with comparison to last year. Report has a summary for each column. Columns:
Interactive sorting: Interactive sorting on all columns except Number store and store name. Source:
|
| Anchor | ||||
|---|---|---|---|---|
|
| Expand | ||
|---|---|---|
| ||
Description: Report lists customer club sales in stores in selected period of time including turnover, gross profit and average quantity sold. Selections:
Output: Report has a summary for each column. Report has a turnover bar chart. On x-axis are: total, not customer club, customer club and employess bars. On y-axis is sales amount. Columns:
Source:
|
| Anchor | ||||
|---|---|---|---|---|
|
| Expand | ||
|---|---|---|
| ||
Description: Report lists loyalty statistic per week in selected year. Selections:
Output: Report shows new members in period and new members years to date in this year and last year for each store in selected year and week Columns:
Source:
|
| Anchor | ||||
|---|---|---|---|---|
|
| Expand | ||
|---|---|---|
| ||
Description: Report lists article item types. Selections:
Output: Report shows list of items by type of item. Columns:
Source:
|
| Anchor | ||||
|---|---|---|---|---|
|
| Expand | ||
|---|---|---|
| ||
Description: Report lists loyalty club sales in stores in selected period of time including turnover, gross profit and average quantity sold. Selections:
Output: Report has a summary for each column. Report has a turnover bar chart. On x-axis are: total, not member, member and employess bars. On y-axis is sales amount. Columns:
Source:
|
| Anchor | ||||
|---|---|---|---|---|
|
| Expand | ||
|---|---|---|
| ||
Description: Report lists members for selected parameters. Selections:
Output: Report shows members list with all details about each member for many selections. Columns:
Clarifications: Report table is too large to fit on one page and part of it is moved to the next page. Selection TOP X (X=) is responsible for number of rows displayed in the table. Source:
|
| Anchor | ||||
|---|---|---|---|---|
|
| Expand | ||
|---|---|---|
| ||
Description: Report lists sent sms. Selections:
Output: Report shows sent sms, where was created and to who. Columns:
Clarifications: Report is from MessageService database. Source:
|
| Anchor | ||||
|---|---|---|---|---|
|
| Expand | ||
|---|---|---|
| ||
Description: Report lists sales statistics about each sold item in stores. Selections:
Output: Report lists statistics about sold items, quantity, campaign sale and gross profit. Table has a summary for each column to sum up all selected stores in period of time. Columns:
Source:
|
| Anchor | ||||
|---|---|---|---|---|
|
| Expand | ||
|---|---|---|
| ||
Description: Report lists Cashier security statistics. Selections:
Output: Summary totals in the beginning of new hierarchy level for stores. After expanding,there is list of cashiers. Columns:
Source:
|
| Anchor | ||||
|---|---|---|---|---|
|
| Expand | ||
|---|---|---|
| ||
Description: Report lists giftcards reconciliation between stores. Selections:
Output: Report has two tables, first is Transaksjoner (Transactions), second is settlement. Report tables are empty, due to empty database. Columns:
Source:
|
| Anchor | ||||
|---|---|---|---|---|
|
| Expand | ||
|---|---|---|
| ||
Description: Report lists weekly sale statistics with comparison to last year. Selections:
Output: Report shows stores sales statistics with less and more than 1 year of operation. Report has a summary for for stores with less than 1 year operation and total summary for all stores at the end of each column. Columns:
Source:
|
| Anchor | ||||
|---|---|---|---|---|
|
| Expand | ||
|---|---|---|
| ||
Description: Report lists total sales for selected stores in selected period of time. Selections:
Output: Report shows total sales statistics with comparison to last year. Report has a summary for each column. Columns:
Interactive sorting: Interactive sorting on all columns except Number store, store name and net cost. Source:
|
| Anchor | ||||
|---|---|---|---|---|
|
| Expand | ||
|---|---|---|
| ||
Description: Report lists price guarantee reconciliation between stores. Selections:
Output: Report has a two tables: Transactions and Settlement. Report tables are empty, due to empty database Columns:
Source:
|
| Anchor | ||||
|---|---|---|---|---|
|
| Expand | ||
|---|---|---|
| ||
CO: 176619 Description: Report shows all items which were not counted during inventory since given date. Selection:
Output: All items which don't appear on last stocktaking. First row is total where under EAN there is a number of all items not counted. Columns:
Sorting:
Source:
|
| Anchor | ||||
|---|---|---|---|---|
|
| Expand | ||
|---|---|---|
| ||
CO: 225452 RTC-28001 Description: Report lists changes in bonus balance and how much bonus is issued and used over a period of time Selection:
Output: Bonus checks overview. For each store sum of issued, redeemed, spent, expired and balance bonus checks with number of sales and members who got/used bonus. Next table with issued amount and member with bonus independent of chosen period. Total sum of each column for all selected stores. Columns:
Clarifications:
Source:
|
| Anchor | ||||
|---|---|---|---|---|
|
| Expand | ||
|---|---|---|
| ||
Description: Report lists sales per VAT code in all stores. Selections:
Output: Report has total summary at the end of table. Columns:
Source: Lindbak POS Reporting Cube (OLAP) |
| Anchor | ||||
|---|---|---|---|---|
|
| Expand | ||
|---|---|---|
| ||
Description: Report lists sales compared to reference item Selections:
Output: Report shows sales compared to reference for selected store in selected date. Columns:
Source:
|
| Anchor | ||||
|---|---|---|---|---|
|
| Expand | ||
|---|---|---|
| ||
Description: Report lists ranking of sold items per hour. Selections:
Output: Report shows top X items sold per hour. Hour column is dependent from sales and will avaible if item will sold. Columns:
Clarifications: Report can show all hours and sales made in selected period of time. It can be full 0-24. To better presentation of report, some hour columns was cut from table manually. Source:
|
| Anchor | ||||
|---|---|---|---|---|
|
| Expand | ||
|---|---|---|
| ||
Description: Report lists ranking of bestseller items, best cashiers and stores in the country and in a particular store. Selections:
Output: Report is divided on 6 tables:
Columns:
Source:
|
| Anchor | ||||
|---|---|---|---|---|
|
| Expand | ||
|---|---|---|
| ||
Description: Report lists customer club sales in stores in selected period of time including turnover, gross profit and average quantity sold. Selections:
Output: Report has a summary for each column. Report has a turnover bar chart. On x-axis are: total, not customer club, customer club and employess bars. On y-axis is sales amount. Columns:
Clarifications: Same as 0104, but uses customergroup rather than customer number for identifying customer club members Source:
|
| Anchor | ||||
|---|---|---|---|---|
|
| Expand | ||
|---|---|---|
| ||
Description: Report lists free items form stampcards. Selections:
Output: Report shows table with divided vendors. Each vendor has a list of stores. Columns:
Source:
|
| Anchor | ||||
|---|---|---|---|---|
|
| Expand | ||
|---|---|---|
| ||
CO-10565 Description: Report lists cash register statistics for stores. Selections:
Output:
Columns:
Clarifications: Total to bank amount is balance cash amount without change amount value. Source:
|
| Anchor | ||||
|---|---|---|---|---|
|
| Expand | ||
|---|---|---|
| ||
Description: Report lists all departments (concepts) per month for all stores. Selections:
Output: Report shows all Stores with all departments, turnover, quantity and gross profit. Report at the end creates total summary table for all stores and departments. Columns:
Clarifications: Due to large report with all stores, screenshot of report was cutted to reasonable size. Source:
|
| Anchor | ||||
|---|---|---|---|---|
|
| Expand | ||
|---|---|---|
| ||
Description: Report lists weekly takings in all departments in stores. Selections:
Output: Report shows weekle takings in stores in each department. Report has a total summary at the end of table. Report has also one total column at the end of each store row. Columns:
Source:
|
| Anchor | ||||
|---|---|---|---|---|
|
| Expand | ||
|---|---|---|
| ||
Description: Report lists weekly sales statistics for all stores. Selections:
Output: Report shows sales statistiscs about all stores in selected week. It shows Sales this week, Budget, Last year, Consept % of sales and KPI. Report has a summary at the end of each column. Columns:
Clarifications: Negative values are marked red. Source:
|
| Anchor | ||||
|---|---|---|---|---|
|
| Expand | ||
|---|---|---|
| ||
Description: Report lists Inter-branch-transfer form. Selections:
Output: Report shows Inter-branch-transfer of goods between stores. Report contain information table and three rows: season, total quantity and date items sent. Season rows is an empty cell. Columns:
Source:
|
| Anchor | ||||
|---|---|---|---|---|
|
| Expand | ||
|---|---|---|
| ||
Description: Report lists international stock adjustments form. Selections:
Output: Report shows store and authorisation details. Report shows which country is related to table. Report has also legend above table with reason code numbers. Report table has a total summary on value column. Columns:
Source:
|
| Anchor | ||||
|---|---|---|---|---|
|
| Expand | ||
|---|---|---|
| ||
Description: Report lists item statistics. Selections:
Output:
Columns:
Source:
|
| Anchor | ||||
|---|---|---|---|---|
|
| Expand | ||
|---|---|---|
| ||
Description: Report lists sale statistics for selected stores in selected period of time. Selections:
Output: Report has a summay total on each column. Columns:
Clarifications: Negative values are marked red. Source:
|
| Anchor | ||||
|---|---|---|---|---|
|
| Expand | ||
|---|---|---|
| ||
Description: Report lists sales statistics from selected country. Selections:
Output: Report shows sales statistics for all countries. Report has a total summary at the end of table on each column and Organiske butikker uten 2266 summarize. Columns:
Source:
|
| Anchor | ||||
|---|---|---|---|---|
|
| Expand | ||
|---|---|---|
| ||
PBI:120761 Description: Report lists new members per store. Selections:
Output: Report shows list of new members in selected period of time with comparison dates range. Report has a summary for teams and total summary for all teams and stores. Report only list a store if there are sales in at least one of the periods (this period, last period or same period last year). Columns:
Source:
|
| Anchor | ||||
|---|---|---|---|---|
|
| Expand | ||
|---|---|---|
| ||
PBI:120758 Description: Report lists recruitment goal for selected stores. Selections:
Output: Report shows list of recruiment goals through week. Columns:
Source:
|
| Anchor | ||||
|---|---|---|---|---|
|
| Expand | ||
|---|---|---|
| ||
CO:10169 Description: Report lists postal codes in store. Selections:
Output: Report shows postal codes, their quantity and period in stores. Columns:
Source:
|
| Anchor | ||||
|---|---|---|---|---|
|
| Expand | ||
|---|---|---|
| ||
CO10145 Description: Report lists statistics about cashiers in stores. Selections:
Relevant parameters: pBalanceTenderType – setting tenders for for balance to type cash Output: Report show statistics about quantity and amount from receipts, items, giftcards and discounts for cashiers in selected stores and period of time. Columns:
Interactive Sorting: Interactive sorting on all columns except Returns excl. reclamations, Deleted item lines gift card, and open drawer Clarifications: Report table is too large to fit on one page and part of it is moved to the next page Source:
|
| Anchor | ||||
|---|---|---|---|---|
|
| Expand | ||
|---|---|---|
| ||
Description: Report lists sales statistics of selected stores. Selections:
Output: Report shows simple sales statistics (net amount and quantity) for selected stores and selected period of time. Report has a summary for each column. Columns:
Clarifications: Report has a 2 textboxes above report table to show dates about printing and data updating. Source:
|
| Anchor | ||||
|---|---|---|---|---|
|
| Expand | ||
|---|---|---|
| ||
Description: Report lists mix coupons in selected period of time for selected stores. Selections:
Output: Report shows sales statistics about mix coupons. Report has a summary at the end of each column. Columns:
Clarifications: Report calculate values for all articles in store. It means it doesn't take only mix articles sold in store, but all articles. As an example look on gross profit % total. Source:
|
| Anchor | ||||
|---|---|---|---|---|
|
| Expand | ||
|---|---|---|
| ||
Descriptions: Report lists all manual discounts for all Cashiers in selected stores. Selections:
Output: Report lists item number with manual discount per cashier name in selected stores. Quantity and Discount are summed up at the end of report. Columns:
Sorting:
Source:
|
| Anchor | ||||
|---|---|---|---|---|
|
| Expand | ||
|---|---|---|
| ||
CO: 10637, PBI#119080 Description: Report lists cashiers settlements. Selections:
Output:
Columns:
Clarifications: Columns with balance and difference values are used only for workstations. Source:
|
| Anchor | ||||
|---|---|---|---|---|
|
| Expand | ||
|---|---|---|
| ||
CO-79777, PBI#149117 Description: Report lists staffing planning report for selected hours in particular date period. Selections:
Output: Report shows time tables with sales and quantity statistics for workstations. Every table has a summary for each column. Columns:
Clarifications: Report type can be workstation or cashier. Negative values are marked red. Source:
|
| Anchor | ||||
|---|---|---|---|---|
|
| Expand | ||
|---|---|---|
| ||
CO-96179 Descriptions: Report shows detailed customer club sales. Selections:
Output: Report lists receipts with price and number of items for selected stores and particular day. Columns:
Source:
|
| Anchor | ||||
|---|---|---|---|---|
|
| Expand | ||
|---|---|---|
| ||
Description: Report lists customer club sales in stores in selected period of time including turnover, receipts, gross profit and average quantity sold. Selections:
Output: Report has a summary for each column. Columns:
Source:
|
| Anchor | ||||
|---|---|---|---|---|
|
| Expand | ||
|---|---|---|
| ||
CO: 54553, PBI#133702 Description: Report lists sale statistics in stores by brand, departments and articles groups. Selections:
Output:
Columns:
Clarifications: Negative values are colored red Source:
|
| Anchor | ||||
|---|---|---|---|---|
|
| Expand | ||
|---|---|---|
| ||
CO-54553, PBI#133703 Description: Report lists sales statistics for selected day. Selections:
Output:
Columns:
Source:
|
| Anchor | ||||
|---|---|---|---|---|
|
| Expand | ||
|---|---|---|
| ||
Description: Report lists club customer sales statistics. Selections:
Output: Report shows list of articles for every customer in store with sales statistics. One store per page. Columns:
Source:
|
| Anchor | ||||
|---|---|---|---|---|
|
| Expand | ||
|---|---|---|
| ||
CO-109712 Description: Report lists internal transfers with net cost. Selections:
Output:
Columns:
Source:
|
| Anchor | ||||
|---|---|---|---|---|
|
| Expand | |||||||||||||||||||||||||||||||||||||||||||||
|---|---|---|---|---|---|---|---|---|---|---|---|---|---|---|---|---|---|---|---|---|---|---|---|---|---|---|---|---|---|---|---|---|---|---|---|---|---|---|---|---|---|---|---|---|---|
| |||||||||||||||||||||||||||||||||||||||||||||
CO: 156791. Based on report 0709. Description: Report allows to follow up store settlement: on first page settlement for all selected cashiers (if all cashiers are selected it equals whole store settlement) and settlement per each cashier on following pages. Report is divided in 9 subreports which will be descriped separatly below. Selections (applies to all subreports):
Subreports:
Source:
|
| Anchor | ||||
|---|---|---|---|---|
|
| Expand | ||
|---|---|---|
| ||
Description: Report lists inventory values per iteam areas. Selections:
Output: Report has on the beginning informations about inventory date and selected store. Report has a summary for inventory values at the end of table. Columns:
Source:
|
| Anchor | ||||
|---|---|---|---|---|
|
| Expand | ||
|---|---|---|
| ||
CO-167575 Descriptions: Report lists broken and waisted items. Selections:
Relevant parameters:
Output: Report shows items, their transaction type with price and quantity for selected stores and their subvendors. Columns:
Clarifications: Report allow to show same items with different transaction types and sum up of quantity and price. It happens under each selected subvendor, which is placed under selected store. Source:
|
| Anchor | ||||
|---|---|---|---|---|
|
| Expand | ||
|---|---|---|
| ||
CO: 162073 Description: Report lists sales and comparison dates sales by product area. Selections:
Output: Report shows sales by product area or group with comparison sales in selected period of time and stores. Report has a summary for each column. Columns:
Source:
|
| Anchor | ||||
|---|---|---|---|---|
|
| Expand | ||
|---|---|---|
| ||
Description: Report lists top sales per item wirh compare date Selections:
Output: Report's table is divided on item areas and has total summary at the end of table on each column. Columns:
Interactive sorting: Interactive sortinge on all columns. Clarifications: Negative values are marked red. Source:
|
| Anchor | ||||
|---|---|---|---|---|
|
| Expand | ||
|---|---|---|
| ||
Description: Report lists sale statistic of items in stores Selections:
Relevant parameters: pArticleIdentifier – Parameter identifies ItemID of article Output:
Columns:
Interactive sorting: Interactive sorting on all columns Source:
|
| Anchor | ||||
|---|---|---|---|---|
|
| Expand | ||
|---|---|---|
| ||
Description: Report lists sales and comparison dates sales by product area. Selections:
Output:
Columns:
Interactive sorting: Interactive sorting on all columns. Source:
|
| Anchor | ||||
|---|---|---|---|---|
|
| Expand | ||
|---|---|---|
| ||
CO: 190620 Description: Report allows to follow upcoming and ongoing campaigns and also browse expired campaigns. Selections:
Output: One row per campaign Columns:
Sorting:
Source:
|
| Anchor | ||||
|---|---|---|---|---|
|
| Expand | ||
|---|---|---|
| ||
CO: 191144 Description: Report allows to follow up article sales and waste grouped per store and per (item group or item area). Selections:
Output: Article sales and waste statistics grouped per store and per item group or item area sorted by highest Lost amount. There is a page break per each store and total all stores in the bottom of last page. If Exclude items without breakage parameter is set to true there will be only items with breakage. Columns:
Sorting:
Clarifications:
Source:
|
| Anchor | ||||
|---|---|---|---|---|
|
| Expand | ||
|---|---|---|
| ||
CO-189967 RTC-20438 Description: Report lists top sales per item in stores. Selections:
Output: Report shows top sales per item in store. One store per page. Report has a summary at the end of each column. Columns:
Interactive Sorting: Interactive sorting on all columns in table. Clarifications: Negative values are marked red. Source:
|
| Anchor | ||||
|---|---|---|---|---|
|
| Expand | ||
|---|---|---|
| ||
Description: Report lists stock list per article group Selections:
Output:
Columns:
Source:
|
| Anchor | ||||
|---|---|---|---|---|
|
| Expand | ||
|---|---|---|
| ||
Description: Report lists stock list per article Selections:
Output: Report shows total summary at the end of table on each column. Columns:
Interactive sorting: Interactive sorting on all columns. Source:
|
| Anchor | ||||
|---|---|---|---|---|
|
| Expand | ||
|---|---|---|
| ||
Description: Report allows to follow up daily sales statistics per one of following: Store/Profile/Team/Total. Selections:
Output: One page per selected accumulation(Store/Profile/Team/Total) One row per day within selected date range and only day within Week day from and Week day to. Columns:
Sorting:
Source:
|
| Anchor | ||||
|---|---|---|---|---|
|
| Expand | ||
|---|---|---|
| ||
Standard report Description: Report allows to follow up nonsales statistics per item per Store or all stores. Selections:
Output: One page per selected accumulation(Store/Total) One row per Article (EAN or Main EAN if tandem switched to no) Article statistics are grouped on multile levels: Subgrouo, Group, Area, Department and Columns:
Sorting:
Source:
|
| Anchor | ||||
|---|---|---|---|---|
|
| Expand | ||
|---|---|---|
| ||
Standard report Description: Report allows to follow up nonsales statistics per item per Store or all stores. Selections:
Output: One row per level selected in Statistics parameter. Columns:
Sorting:
Source:
|
| Anchor | ||||
|---|---|---|---|---|
|
| Expand | ||
|---|---|---|
| ||
Description: Report allows to follow up sales statistics on Department level. Selections:
Output: One page per Store One row per Department Columns:
Sorting:
Source:
|
| Anchor | ||||
|---|---|---|---|---|
|
| Expand | ||
|---|---|---|
| ||
Standard report Description: Report lists department sales for each item area in stores. Selections:
Relevant parameters: pPriceChannels – hidden parameter use all price channels keys Output:
Columns:
Source:
|
| Anchor | ||||
|---|---|---|---|---|
|
| Expand | ||||||||||||||||||||||||||||||
|---|---|---|---|---|---|---|---|---|---|---|---|---|---|---|---|---|---|---|---|---|---|---|---|---|---|---|---|---|---|---|
| ||||||||||||||||||||||||||||||
Standard report Description: Report allows to follow up store settlement: on first page settlement for all selected cashiers (if all cashiers are selected it equals whole store settlement) and settlement per each cashier on following pages. Report is divided in subreports which will be descriped separatly below. Selections (applies to all subreports):
Subreports:
Source:
|
| Anchor | ||||
|---|---|---|---|---|
|
| Expand | ||||||||||||||||||||||||||||||
|---|---|---|---|---|---|---|---|---|---|---|---|---|---|---|---|---|---|---|---|---|---|---|---|---|---|---|---|---|---|---|
| ||||||||||||||||||||||||||||||
Standard report Description: Report allows to follow up store settlement: on first page settlement for all selected workstations (if all cashiers are selected it equals whole store settlement) and settlement per each workstation on following pages. Report is divided in subreports which will be descriped separatly below. Selections (applies to all subreports):
Subreports:
Source:
|
| Anchor | ||||
|---|---|---|---|---|
|
| Expand | ||
|---|---|---|
| ||
Standard report Description: Report lists sale statistics for stores with drilldowns. Selections:
Output:
Columns:
Source:
|
| Anchor | ||||
|---|---|---|---|---|
|
| Expand | ||
|---|---|---|
| ||
Standard report Description: Report lists stock turnover. Selections:
Output:
Columns:
Source:
|
| Anchor | ||||
|---|---|---|---|---|
|
| Expand | ||
|---|---|---|
| ||
Standard report Description: Report lists details about stock turnover for selected store. Selections:
Output:
Columns:
Source: Lindbak POS Reporting Cube (OLAP) |
| Anchor | ||||
|---|---|---|---|---|
|
| Expand | ||
|---|---|---|
| ||
Standard report Description: Report lists item group sales information with drilldowns. Selections:
Output:
Columns:
Source:
|
| Anchor | ||||
|---|---|---|---|---|
|
| Expand | ||
|---|---|---|
| ||
Standard report Description: Report lists item group sales details with drilldowns. Selections:
Output:
Columns:
Source:
|
| Anchor | ||||
|---|---|---|---|---|
|
| Expand | ||
|---|---|---|
| ||
Standard report Description: Report lists sales per cashier with bar chart. Selections:
Output:
Columns:
Interactive sorting: Interactive sorting on all columns. Source:
|
| Anchor | ||||
|---|---|---|---|---|
|
| Expand | ||
|---|---|---|
| ||
Description: Report lists stock per item on chart. Selections:
Output: Report shows chart with stock per item in selected period of time. Chart has a legend which represent line curve with dots on x-axis. Columns:
Source:
|
| Anchor | ||||
|---|---|---|---|---|
|
| Expand | ||||||||||||||||||||||||||||||||||||||||||||||||||
|---|---|---|---|---|---|---|---|---|---|---|---|---|---|---|---|---|---|---|---|---|---|---|---|---|---|---|---|---|---|---|---|---|---|---|---|---|---|---|---|---|---|---|---|---|---|---|---|---|---|---|
| ||||||||||||||||||||||||||||||||||||||||||||||||||
Description: Report allows to follow up store settlement for selected Z number. Report is divided in 10 subreports which are descriped separatly below. Selections (applies to all subreports):
Clarifiacations: Z number is End of bussiness day date for selected store and workstation Subreports:
Source:
|
| Anchor | ||||
|---|---|---|---|---|
|
| Expand | ||
|---|---|---|
| ||
Standard report Description: Report lists accumulated sales and returns in cashregister. Selections:
Output: Report has three one row's tables with two Gauge panels. Gauge panels shows sales to the last year sales in week and day ratio. Columns:
Source:
|
| Anchor | ||||
|---|---|---|---|---|
|
| Expand | |||||||||||||||||||||||||||||||||||||||||||||
|---|---|---|---|---|---|---|---|---|---|---|---|---|---|---|---|---|---|---|---|---|---|---|---|---|---|---|---|---|---|---|---|---|---|---|---|---|---|---|---|---|---|---|---|---|---|
| |||||||||||||||||||||||||||||||||||||||||||||
Description: Report allows to follow up store settlement for selected workstation Report is divided in 9 subreports which are descriped separatly below. Selections (applies to all subreports):
Subreports:
Source:
|
| Anchor | ||||
|---|---|---|---|---|
|
| Expand | ||
|---|---|---|
| ||
Standard report Description: Report allows to follow up meber and member sale statistics divided by member age and member gender. Selections:
Output: Report is devided in 5 sections:
Columns:
Sorting:
Clarifications:
Source:
|
| Anchor | ||||
|---|---|---|---|---|
|
| Expand | ||
|---|---|---|
| ||
Standard report Description: Report allows to follow up specific member activities. Selections:
Output: There are two sections:
Columns:
Source:
|
| Anchor | ||||
|---|---|---|---|---|
|
| Expand | ||
|---|---|---|
| ||
Standard report Description: Report allows to follow up sales in specific locations. Selections:
Output: One row per one item sold in specific LocationKey from DimStockLocation. Data is presented per item group. Columns:
Source:
|
| Anchor | ||||
|---|---|---|---|---|
|
| Expand | ||
|---|---|---|
| ||
Standard report Description: Report allows to follow usage of giftcards. Selections:
Output: One row per one item sold in specific LocationKey from DimStockLocation. Data is presented per item group. Columns:
Source:
|
| Anchor | ||||
|---|---|---|---|---|
|
| Expand | ||
|---|---|---|
| ||
Description: Report allows to follow up sales in specific locations. Selections:
Output: One row per one item sold in specific LocationKey from DimStockLocation. Data is presented per item group. Columns:
Source:
|
| Anchor | ||||
|---|---|---|---|---|
|
| Expand | ||
|---|---|---|
| ||
Description: Report lists turnover sales per hour for article. Selections:
Output: Report shows sales statistics per hour and per item. Report has a sales statistics table with selected date and compared date with hours rows. Table has a total summary on each column. Report has also two charts. First chart shows turnover per hour. On x-axis is date 1 and date 2 with hours bars, on y-axis is turnover amount. Second chart shows total turnover with x-axis: date 1 and date 2, and y-axis as turnover amount. Columns:
Source:
|
| Anchor | ||||
|---|---|---|---|---|
|
| Expand | ||
|---|---|---|
| ||
Description: Report lists article group sales details without subgroups. Selections:
Output:
Columns:
Source:
|
| Anchor | ||||
|---|---|---|---|---|
|
| Expand | ||
|---|---|---|
| ||
Description: Report allows to follow up sales in specific locations. Selections:
Output: One row per one item sold in specific LocationKey from DimStockLocation. Data is presented per item group. Columns:
Source:
|
| Anchor | ||||
|---|---|---|---|---|
|
| Expand | ||
|---|---|---|
| ||
Description: Report allows to follow up sales in specific locations. Selections:
Output: One row per one item sold in specific LocationKey from DimStockLocation. Data is presented per item group. Columns:
Source:
|
| Anchor | ||||
|---|---|---|---|---|
|
| Expand | ||
|---|---|---|
| ||
Description: Report allows to follow up sales in specific locations. Selections:
Output: One row per one item sold in specific LocationKey from DimStockLocation. Data is presented per item group. Columns:
Clarifications: Negative values in report are marked red. Source:
|
| Anchor | ||||
|---|---|---|---|---|
|
| Expand | |||||||||||||||||||||||||
|---|---|---|---|---|---|---|---|---|---|---|---|---|---|---|---|---|---|---|---|---|---|---|---|---|---|
| |||||||||||||||||||||||||
Description: Report allows to follow up store settlement: on first page settlement for all selected workstations (if all cashiers are selected it equals whole store settlement) and settlement per each workstation on following pages. Report is divided in subreports which will be descriped separatly below. Selections (applies to all subreports):
Subreports:
Source:
|
| Anchor | ||||
|---|---|---|---|---|
|
| Expand | ||
|---|---|---|
| ||
Description: Report allows to check new members. Selections:
Output: One row per new member Columns:
Source:
|
| Anchor | ||||
|---|---|---|---|---|
|
| Expand | ||
|---|---|---|
| ||
Description: Report allows to check new members. Selections:
Output: One row per new member Columns:
Source:
|
| Anchor | ||||
|---|---|---|---|---|
|
| Expand | ||
|---|---|---|
| ||
Description: Report lists member transactions. Selections:
Output: Report shows two tables: member transactions and member sales. Member sales table has a summary for amount of member sales. Columns:
Source:
|
| Anchor | ||||
|---|---|---|---|---|
|
| Expand | |||||||||||||||||||||||||
|---|---|---|---|---|---|---|---|---|---|---|---|---|---|---|---|---|---|---|---|---|---|---|---|---|---|
| |||||||||||||||||||||||||
Description: Report allows to follow up workstation settlement: on first page settlement for all selected workstations (if all cashiers are selected it equals whole store settlement) and settlement per each workstation on following pages. Report is divided in subreports which will be descriped separatly below. Selections (applies to all subreports):
Subreports:
Source:
|
| Anchor | ||||
|---|---|---|---|---|
|
| Expand | ||
|---|---|---|
| ||
Description: Report allows to follow up avg. member sales. Report divides sales data for months Selections:
Output: Graphs show sales amount and sales quantity. Table is divided in to parts - amount and quantity Columns:
Source:
|
| Anchor | ||||
|---|---|---|---|---|
|
| Expand | ||
|---|---|---|
| ||
Description: Report allows to follow up avg. member sales. Report divides sales data for weeks Selections:
Output: Graphs show sales amount and sales quantity. Table is divided in to parts - amount and quantity Columns:
Source:
|
| Anchor | ||||
|---|---|---|---|---|
|
| Expand | ||
|---|---|---|
| ||
Description: Report allows to follow up meber and member sale statistics divided by member age and member gender. Selections:
Output: Report is devided in 5 sections:
Columns:
Sorting:
Clarifications:
Source:
|
| Anchor | ||||
|---|---|---|---|---|
|
| Expand | ||
|---|---|---|
| ||
Description: Report lists details about memebers. Selections:
Output: Report shows table about change history. Report has also member details like personal information, household, member details gdpr subscriptions and other. Columns:
Source:
|
| Anchor | ||||
|---|---|---|---|---|
|
| Expand | ||
|---|---|---|
| ||
Description: Report lists all member activities for selected member. Selections:
Output: List of member activities and sales. Columns:
Clarifications:
Source:
|
| Anchor | ||||
|---|---|---|---|---|
|
| Expand | ||
|---|---|---|
| ||
Description: Created on request from product because funtion SALE_STAT in CR only gets data from Chain classic. This report is optimized to run from Cash register with resolution set to 1024 * 768. Meant to use for cashiers to check sales statistics from today. Selections:
Output: Report is divided into two sections. First is showing graphical sale per hour. Second is showing sale statistics for cashiers. Columns: For seciton one. One row per cashier and one row for total on top.
Sorting:
Clarifications:
Source:
|
| Anchor | ||||
|---|---|---|---|---|
|
| Expand | ||
|---|---|---|
| ||
Description: General report for item transaction. This report will show all item transactions with reason code. Source:
Selections:
Relevant parameters:
Output: List of item transactions with reason code Columns (sum for store and each level of hierarchy. Sum total on last row):
Clarifications:
|
| Anchor | ||||
|---|---|---|---|---|
|
| Expand | ||
|---|---|---|
| ||
RTC-27768 Description: Report lists all reasoncodes for all stores. Layout of the report makes it easy to export data to Excel. Selections:
Relevant parameters:
Output: List of item transactions with reason codes Columns (interactive sorting on Storenum, Storename, Transaction type and Reason code):
Clarifications:
|
| Anchor | ||||
|---|---|---|---|---|
|
| Expand | ||
|---|---|---|
| ||
Description: RTP-33121 General report for item transaction. This report will show all item transactions with reason code. Report is similar to 0541 without item number and two extra columns for net cost. Source:
Selections:
Relevant parameters:
Output: List of item transactions with reason code Columns (sum for store and each level of hierarchy. Sum total on last row):
Clarifications:
|
| Anchor | ||||
|---|---|---|---|---|
|
| Expand | ||
|---|---|---|
| ||
Description: Report lists sales per itemgroup. Selections:
Output: Report shows sales statistics for itemgroup in selected period of time and for selected store. Columns:
Source:
|
| Anchor | ||||
|---|---|---|---|---|
|
| Expand | ||
|---|---|---|
| ||
Description: Report shows sales aggregated by article group and VAT. Selections:
Output: Report shows sales per itemgroup. Report shows three tables: fuel, bulk products and item sales. Report has summary for each table and total summary for all stores. Columns:
Source:
|
| Anchor | ||||
|---|---|---|---|---|
|
| Expand | ||
|---|---|---|
| ||
Description: Report lists item group sales with drilldown for selected stores Selections:
Output:
Columns:
Clarifications: Negative values are colored red. Source:
|
| Anchor | ||||
|---|---|---|---|---|
|
| Expand | ||
|---|---|---|
| ||
Description: Report lists sales per hour with counting customer inside and outside. Selections:
Output:
Columns:
Source:
|
| Anchor | ||||
|---|---|---|---|---|
|
| Expand | ||
|---|---|---|
| ||
Description: Report lists sales and waste per article Selections:
Output:
Columns:
Source:
|
| Anchor | ||||
|---|---|---|---|---|
|
| Expand | ||
|---|---|---|
| ||
Description: Report lists sales and waste per article Selections:
Output:
Columns:
Source:
|
| Anchor | ||||
|---|---|---|---|---|
|
| Expand | ||
|---|---|---|
| ||
Description: Report lists sales statistics about items in selected store and comparable store and their difference. Selections:
Output:
Columns:
Source: Lindbak POS Reporting Cube (OLAP) |
| Anchor | ||||
|---|---|---|---|---|
|
| Expand | ||
|---|---|---|
| ||
Description: Report lists sales per item. Selections:
Output: Report shows sales per item with summary for item groups and total summary for all item groups. Columns:
Source:
|
| Anchor | ||||
|---|---|---|---|---|
|
| Expand | ||
|---|---|---|
| ||
Description: Report lists sales per department Selections:
Output: Report shows four tables: fuel, retail goods, automatic car wsa and groups. Each table has a summary and report has total summarize for all tables. Columns:
Source:
|
| Anchor | ||||
|---|---|---|---|---|
|
| Expand | ||
|---|---|---|
| ||
RTC-14247 Description: Report lists sales per article group with breakage. Selections:
Output: Report shows sales per article group with breakage Columns:
Source:
|
| Anchor | ||||
|---|---|---|---|---|
|
| Expand | ||
|---|---|---|
| ||
CO-198145, RTC-19436 Description: Report lists sales per article subgroup and VAT with export to CSV Selections:
Output: Report shows sales per item subgroup Columns:
Source:
|
| Anchor | ||||
|---|---|---|---|---|
|
| Expand | ||
|---|---|---|
| ||
CO-217863, RTC-25043 Description: Report lists sales per article subgroup and VAT Selections:
Output: Report shows sales per item subgroup. Report has a summary for each item group and total summary for whole table Columns:
Source:
|
| Anchor | ||||
|---|---|---|---|---|
|
| Expand | ||||||||||||||||||||||||||||||||||||||||||||||||||||||||||||||||||||||||||||||||
|---|---|---|---|---|---|---|---|---|---|---|---|---|---|---|---|---|---|---|---|---|---|---|---|---|---|---|---|---|---|---|---|---|---|---|---|---|---|---|---|---|---|---|---|---|---|---|---|---|---|---|---|---|---|---|---|---|---|---|---|---|---|---|---|---|---|---|---|---|---|---|---|---|---|---|---|---|---|---|---|---|
| ||||||||||||||||||||||||||||||||||||||||||||||||||||||||||||||||||||||||||||||||
CO-256310, RTC-30351 Description: Report allows to follow up store settlement: on first page settlement for all selected workstations and settlement per each workstation on following pages. Report is divided in 16 subreports which will be descriped separatly below. Selections (applies to all subreports):
Parameters:
Clarifications: Report is mostly based on 0016_StoreSettlementPerWorkstation_std report. Additionaly report contains new 1022_subPaymentCard report, GLN code for each store in title and multivalue selections for stores. Subreports:
Source:
|
| Anchor | ||||
|---|---|---|---|---|
|
| Expand | ||||||||||||||||||||||||||||||
|---|---|---|---|---|---|---|---|---|---|---|---|---|---|---|---|---|---|---|---|---|---|---|---|---|---|---|---|---|---|---|
| ||||||||||||||||||||||||||||||
CO-262513 RTC-31644 Description: Report allows to follow up store settlement. On first page per storefor all selected cashiers (if all cashiers are selected it equals whole store settlement) and settlement per each cashier on following pages. Report is divided in subreports which will be descriped separatly below. Selections:
Subreports:
|
| Anchor | ||||
|---|---|---|---|---|
|
| Expand | |||||||||||||||||||||||||||||||||||
|---|---|---|---|---|---|---|---|---|---|---|---|---|---|---|---|---|---|---|---|---|---|---|---|---|---|---|---|---|---|---|---|---|---|---|---|
| |||||||||||||||||||||||||||||||||||
CO-262513 RTC-31644 Description: Report allows to follow up store settlement. On first page per store, data for all selected cash registers (if all cash registers are selected it equals whole store settlement) and settlement per each cash register on following pages. Report is divided in subreports which will be descriped separatly below. Selections:
Subreports:
|
| Anchor | ||||
|---|---|---|---|---|
|
| Expand | ||
|---|---|---|
| ||
CO-273435 Description: Report lists data from some of sections used in 0612. Output is to make it easier for exporting data to csv format. Selections:
Parameters:
Output: Report lists data from sub-reports listed below in one line per store section (sub-report) type and measure. Data is aggregated per store within date selection. Columns:
|
| Anchor | ||||
|---|---|---|---|---|
|
| Expand | ||
|---|---|---|
| ||
CO-281808 / RTC-36615 Description: Store list provides a list of stores with key information. List of stores are grouped by profile. It is possible to exclude closed stores from the lists. NB! Report require Reporting v81 or higher. Selections:
Output: Report lists Stores with information key information. It is possible to include / exclude closed stores, this is based on Closing date and provided date in selection. Columns:
Source: Lindbak POS Reporting DW |
| Anchor | ||||
|---|---|---|---|---|
|
| Expand | ||
|---|---|---|
| ||
CO-1904 Description: Report lists credit sales for all stores in selected period time. Selections:
Output: Report lists every sale in period time with name of customer, references and amount. Report sum up Amount and Tax amount. Columns:
Source:
|
| Anchor | ||||
|---|---|---|---|---|
|
| Expand | ||
|---|---|---|
| ||
Description: Report lists sales in department per store. Selections:
Output: Each department has own column. Report has a summary for each column except Total share. One store per row. Columns:
Clarifications: Each new added department to report create new column in report table. Report table can be too large and may be divided into several pages. Source:
|
| Anchor | ||||
|---|---|---|---|---|
|
| Expand | ||
|---|---|---|
| ||
Description: Report shows sales per department and store Selections:
Relevant parameters: pHourFrom and pHoursTo are used to shows hours in column Output:
Columns:
Source:
|
| Anchor | ||||
|---|---|---|---|---|
|
| Expand | ||
|---|---|---|
| ||
Description: Report lists Coupon summary for particular store. Selections:
Output:
Columns:
Source:
|
| Anchor | ||||
|---|---|---|---|---|
|
| Expand | ||
|---|---|---|
| ||
Description: Report lists credit sales per customer. Selections:
Output:
Columns:
Source:
|
| Anchor | ||||
|---|---|---|---|---|
|
| Expand | ||
|---|---|---|
| ||
Description: Report lists discount per cashier Selections:
Output:
Columns:
Source:
|
| Anchor | ||||
|---|---|---|---|---|
|
| Expand | ||
|---|---|---|
| ||
Description: Report lists cash register frequence per day. Selections:
Output: Report shows table for selected store with cash register frequence per day. Report has a summary for each column. Columns:
Source: Lindbak POS Reporting Cube (OLAP) |
| Anchor | ||||
|---|---|---|---|---|
|
| Expand | ||
|---|---|---|
| ||
Description: Report lists cash register frequence per hour for stores in selected workstations. Selections:
Output: Report shows tables for selected stores with frequence of cash register. Report has a summary for each column, for each table. Columns:
Source:
Additional info:
|
| Anchor | ||||
|---|---|---|---|---|
|
| Expand | ||
|---|---|---|
| ||
Based on 0037 Report. Description: Report lists sales for selected store in period of time. Selections:
Output: Report lists sales for one row per store. Report sum up every column. Columns:
Sorting: Interactive sorting on all except Sale ex. VAT, Tax amount, Cos and Gross profit Source:
|
| Anchor | ||||
|---|---|---|---|---|
|
| Expand | ||
|---|---|---|
| ||
Description: Report lists historical balance on given date. Selections:
Output: Report has a summary at the end of table. Columns:
Source:
|
| Anchor | ||||
|---|---|---|---|---|
|
| Expand | ||||||||||||||||||||||||||||||||||||||||
|---|---|---|---|---|---|---|---|---|---|---|---|---|---|---|---|---|---|---|---|---|---|---|---|---|---|---|---|---|---|---|---|---|---|---|---|---|---|---|---|---|
| ||||||||||||||||||||||||||||||||||||||||
CO: 10400, PBI#90853 Description: Report allow to follow up store settlement: all selected Chahiers (if all cashiers are selected it equals whole store settlement) and settlement per each Cashier on following pages. Selections:
Subreports:
Source:
|
| Anchor | ||||
|---|---|---|---|---|
|
| Expand | ||
|---|---|---|
| ||
CO: 10625, PBI#116476 Description: Report lists sales per store with comparison sales and difference. Selections:
Output: Report lists sales in stores in selected period of time and comparison sales in other selected period of time with difference both sales. Report has a summary of each column. Columns:
Clarifications: Negative values are colored red. Source:
|
| Anchor | ||||
|---|---|---|---|---|
|
| Expand | ||
|---|---|---|
| ||
CO: 10603, PBI#116490 Description: Report lists sales per department with comparison sales. Selections:
Output:
Columns:
Sorting: No – Department number (default sorting) Clarifications: Negative values are colored red. Source:
|
| Anchor | ||||
|---|---|---|---|---|
|
| Expand | ||
|---|---|---|
| ||
CO: 10626, PBI#116469 Description: Report lists sales per vendor with comparison sales. Selections:
Output: Report has a summary of each column. One page per store. Columns:
Sorting: Vendor No – Vendor number (default sorting) Clarifications: Negative values are colored red. Source:
|
| Anchor | ||||
|---|---|---|---|---|
|
| Expand | ||
|---|---|---|
| ||
CO: 10626, PBI#116469 Description: Report lists sales per vendor with comparison sales. Selections:
Output: Report has a summary of each column. One page per store. Columns:
Clarifications: Negative values are colored red. Source:
|
| Anchor | ||||
|---|---|---|---|---|
|
| Expand | ||
|---|---|---|
| ||
CO-10606, PBI#116498 Description: Report lists sales statistics with drilldowns. Selections:
Output:
Columns:
Source:
|
| Anchor | ||||
|---|---|---|---|---|
|
| Expand | ||
|---|---|---|
| ||
CO-10609, PBI#116527 Description: Report lists top sales statistics per item with compare selected date. Selections:
Output: Report is divided on particular departments by selected grouping. Report has as summary for each department and total summary at the end of table. Columns:
Source:
|
| Anchor | ||||
|---|---|---|---|---|
|
| Expand | ||
|---|---|---|
| ||
CO-10608, PBI#116508 Description: Report lists turnover per hour for articles in comparison to last year. Selections:
Output:
Columns:
Clarifications: Negative values are colored red. Source:
|
| Anchor | ||||
|---|---|---|---|---|
|
| Expand | ||
|---|---|---|
| ||
CO-10610, PBI#116539 Description: Report lists article sales per operator. Selections:
Output: Report shows list of sales articles for each cashier in selected stores. Columns:
Source:
|
| Anchor | ||||
|---|---|---|---|---|
|
| Expand | ||
|---|---|---|
| ||
CO: 70942, PBI#144616 Description: Report lists discount per cashier with selected department Selections:
Output:
Columns:
Source:
|
| Anchor | ||||
|---|---|---|---|---|
|
| Expand | ||
|---|---|---|
| ||
CO: 115424 Description: Report lists expiration dates of items including transaction type internal use with reason code. Selections:
Columns:
Output: Raport shows list of items for selected store and departments, and also for selected Article ares and groups. It is one row per EAN and present expiration date including transaction type internal use with reason code. Clarifications:
Source:
|
| Anchor | ||||
|---|---|---|---|---|
|
| Expand | ||||||||||||||||||||||||||||||||||||||||||||||||||||||||||||
|---|---|---|---|---|---|---|---|---|---|---|---|---|---|---|---|---|---|---|---|---|---|---|---|---|---|---|---|---|---|---|---|---|---|---|---|---|---|---|---|---|---|---|---|---|---|---|---|---|---|---|---|---|---|---|---|---|---|---|---|---|
| ||||||||||||||||||||||||||||||||||||||||||||||||||||||||||||
Standard report Description: Report allows to follow up store settlement: on first page settlement for all selected cashiers (if all cashiers are selected it equals whole store settlement) and settlement per each cashier on following pages. Report is divided in 12 subreports which will be descriped separatly below. Selections (applies to all subreports):
Subreports:
Source:
|
| Anchor | ||||
|---|---|---|---|---|
|
| Expand | |||||||||||||||||||||||||||||||||||||||||||||||||||||||||||||||||||||||||||
|---|---|---|---|---|---|---|---|---|---|---|---|---|---|---|---|---|---|---|---|---|---|---|---|---|---|---|---|---|---|---|---|---|---|---|---|---|---|---|---|---|---|---|---|---|---|---|---|---|---|---|---|---|---|---|---|---|---|---|---|---|---|---|---|---|---|---|---|---|---|---|---|---|---|---|---|
| |||||||||||||||||||||||||||||||||||||||||||||||||||||||||||||||||||||||||||
Description: Report allows to follow up store settlement: on first page settlement for all selected workstations and settlement per each workstation on following pages. Report is divided in 15 subreports which will be descriped separatly below. Selections (applies to all subreports):
Subreports:
Source:
|
| Anchor | ||||
|---|---|---|---|---|
|
| Expand | ||
|---|---|---|
| ||
Description: Report lists wet stock in stores. Selections:
Output: Each selected store has own table and total summary at the end of table. Columns:
Clarifications: Variance percentage will be red when value different than zero. Source:
|
| Anchor | ||||
|---|---|---|---|---|
|
| Expand | ||
|---|---|---|
| ||
Description: Report lists daily wet stock Selections:
Output: Report shows list of fuel tank groups with article name in each group. One page per fuel tank group. Columns:
Source:
|
| Anchor | ||||
|---|---|---|---|---|
|
| Expand | ||
|---|---|---|
| ||
CO based on report 0714 Description: Report allows to follow up article sales on multiple levels with possibility to select specific hourly intervals and exclude specific item groups. Selections:
Output: Article sale statistics for selected stores, for selected date interval and for selected time interval grouped by department, area and group. By default data is shown for department and it is possible to drill down to item level manually by clicng plus button or by using expand all button to expand everithing to item level at once. Columns:
Sorting:
Clarifications:
Hidden parameters:
Source:
|
| Anchor | ||||
|---|---|---|---|---|
|
| Expand | ||
|---|---|---|
| ||
CO-196622, RTC-18368 Description: Report lists turnover per hour for articles in comparison to last year. Selections:
Output:
Columns:
Source:
|
| Anchor | ||||
|---|---|---|---|---|
|
| Expand | ||
|---|---|---|
| ||
Description: Report lists top sales statistics per item with compare date. Selections:
Output: Report shows table for all store on the beginning and one store table per page. Report has a summary for each table at the end of columns. Columns:
Clarifications:
Hidden parameters:
Source:
|
| Anchor | ||||
|---|---|---|---|---|
|
| Expand | ||
|---|---|---|
| ||
CO: 207212. Based on report 0754 Description: Report allows to find given number of best or worst selling items on multiple levels (amount, quantity, gross profit) in two date intervals. Possible to select specific hourly interval. Selections:
Output: Sale statistics for selected number of best or worst items per store sorted by selected sort measure devided in two selected date intervals in selected hour range. Columns:
Sorting:
Clarifications:
Hidden parameters:
Source:
|
| Anchor | ||||
|---|---|---|---|---|
|
| Expand | ||
|---|---|---|
| ||
CO: 208778. Based on report 0650 Description: Report shows credit sales and payments on account to get a better overview over drive-offs. Selections:
Output: One row per transaction grouped by store and customer. Page break and total for each store. Columns:
Sorting:
Clarifications: Transaction can be either Credit sale or Payment on account. If transaction is Payment on account there is no data available for columns: Ref.no and Ref.text Source:
|
| Anchor | ||||
|---|---|---|---|---|
|
| Expand | ||
|---|---|---|
| ||
Description: Reports lists mix coupons for selected stores in selected period of time. Selections:
Output: Report shows extended mixmatch sales statistics. For one page per store there is a list grouped by mix. Report has a total summaty at the end of table. Columns:
Clarifications: Report has a star explanation for a few columns. It means that summary values for particular mix are calculated including all transactions in store. As an example '% Items sold' is calculating by taking quantity and dividing it by whole store quantity. For whole mix it will be store quantity of all items in store. For particular article in that mix '% Items sold', quantity of that product in mix will be divided by all articles in that mix. Summary for mix (grey grouped row) takes whole statistics about store, even if it is not mix. Source:
|
| Anchor | ||||
|---|---|---|---|---|
|
| Expand | ||
|---|---|---|
| ||
CO-271850 based on 0603_SalesPerHour Description: Report lists sales per hour with counting customer inside and outside. It also compares inside / outside data with selected period. Selections:
Parameters:
Output:
Columns:
Source:
|
| Anchor | ||||
|---|---|---|---|---|
|
| Expand | ||||||||||||||||||||||||||||||||||||||||
|---|---|---|---|---|---|---|---|---|---|---|---|---|---|---|---|---|---|---|---|---|---|---|---|---|---|---|---|---|---|---|---|---|---|---|---|---|---|---|---|---|
| ||||||||||||||||||||||||||||||||||||||||
Standard report Description: Report allows to follow up sales in a specified store: comparing fuel and non fuel articles on all product groups, selected tender measures, VAT and measures like: cash balance, card movements, card sales and shift statistics. Depending on number of results it can be multi page. Report is divided in 8 subreports which will be descriped separatly below. Selections (applies to all subreports):
Hidden parameters:
Subreports:
Source:
|
| Anchor | ||||
|---|---|---|---|---|
|
| Expand | ||
|---|---|---|
| ||
[RTC-44550] [YXB] New cashier statistics report (0781) with Fuel column (CO-344179) Description:
Selections:
Hidden parameters:
Output: One page per store - one row per cashier Columns:
Sorting:
Source:
|
| Anchor | ||||
|---|---|---|---|---|
|
| Expand | ||
|---|---|---|
| ||
[RTC-39849] TRN: Cashier security statistics report with turnover split and price checks - EG A/S Description:
Selections:
Output: One page per store One row per cashier Columns:
Sorting:
Source:
|
| Anchor | ||||
|---|---|---|---|---|
|
| Expand | ||
|---|---|---|
| ||
[RTC-44692] [TRN] Shift balance report (CO-335148) PIC - TO BE UPDATED Description:
Selections:
Output: The report consist of four tables:
Columns:
Sorting:
Source:
|
| Anchor | ||||
|---|---|---|---|---|
|
| Expand | ||
|---|---|---|
| ||
Description: Report lists top items sold in selected stores in period time. Selections:
Output: Report shows top x items and item groups with their amount, gross profit and quantity in selected ranges. Report sum up all columns with numbers. Columns:
Clarifications: If vendor name is not avaible return empty rows. Source:
|
| Anchor | ||||
|---|---|---|---|---|
|
| Expand | ||
|---|---|---|
| ||
Description: Report lists how often customer buys product in comparison to previous period time. Selections:
Output: Report shows amount, number of customers and sold items for selected stores, regions and period time in comparison to previous selected period time. Raport presents percentage differences and sum up all columns for selected stores Columns:
Clarifications: Diff % is percentage difference (increase or decrease) between date and comparable date Source:
|
| Anchor | ||||
|---|---|---|---|---|
|
| Expand | ||
|---|---|---|
| ||
Description: Report lists sales per department and comparison sales in selected period of time. Selections:
Output:
Columns:
Source:
|
| Anchor | ||||
|---|---|---|---|---|
|
| Expand | ||
|---|---|---|
| ||
Description: Report lists sales per assortment and comparison sales in selected period of time. Selections:
Output:
Columns:
Source:
|
| Anchor | ||||
|---|---|---|---|---|
|
| Expand | ||
|---|---|---|
| ||
Description: Report lists dashboard comparison sales, gross profit and customers with compare date for one day and the whole week. Selections:
Output:
Columns:
Source:
|
| Anchor | ||||
|---|---|---|---|---|
|
| Expand | ||
|---|---|---|
| ||
Description: Report lists reconciliation of giftcards. Selections:
Output: Report shows reconciliation of giftcards with statistics for selected stores. Columns:
Interactive sorting: Interactive sorting on all columns Source:
|
| Anchor | ||||
|---|---|---|---|---|
|
| Expand | ||
|---|---|---|
| ||
Description: Report lists giftcard balance per store. Selections:
Output: Report has a summary at the end of table. Columns:
Source:
|
| Anchor | ||||
|---|---|---|---|---|
|
| Expand | ||
|---|---|---|
| ||
Description: Report lists reconciliation of giftcards per store. Selections:
Output: Report has table for each store and summary at the end of each column on that table. Columns:
Interactive sorting: Interactive sorting on all columns. Source:
|
| Anchor | ||||
|---|---|---|---|---|
|
| Expand | ||
|---|---|---|
| ||
CO-99244, PBI#155899 Description: Report lists members and e-mail/SMS subscriptions Selections:
Output: Report shows members with e-mail/SMS subscriptions, one row per store with summary of each column. Columns:
Source:
|
| Anchor | ||||
|---|---|---|---|---|
|
| Expand | ||
|---|---|---|
| ||
CO-99233, PBI#155902. Based on report 0519 Description: Report lists loyalty statistics. Selections:
Output: Report is divided on 4 tables and 2 charts. Every table has a stotal sumamry at the end table for each column. Columns:
Source:
|
| Anchor | ||||
|---|---|---|---|---|
|
| Expand | ||
|---|---|---|
| ||
CO-92729, PBI#155905 Description: Report lists sales in selected stores in loyalty clubs. Report also present turnover chart. Selections:
Output:
Columns:
Source:
|
| Anchor | ||||
|---|---|---|---|---|
|
| Expand | ||
|---|---|---|
| ||
Description: Report list shift statistic for selected stores and period time Selections:
Relevant parameters:
Output:
Columns:
Source:
|
| Anchor | ||||
|---|---|---|---|---|
|
| Expand | ||||||||||
|---|---|---|---|---|---|---|---|---|---|---|
| ||||||||||
Description: Report allow to follow up tender per shift. Report has two subreports, one settlement and second about statistics. Selections:
Subreports:
Source:
|
| Anchor | ||||
|---|---|---|---|---|
|
| Expand | ||
|---|---|---|
| ||
Description: Report lists member sales per association. Selections:
Output:
Columns:
Source:
|
| Anchor | ||||
|---|---|---|---|---|
|
| Expand | ||
|---|---|---|
| ||
Description: Report lists new discount tgroup for member Selections:
Output: Report shows customer discount group list for member Columns:
Source: Lindbak POS Reporting Cube (OLAP) |
| Anchor | ||||
|---|---|---|---|---|
|
| Expand | ||
|---|---|---|
| ||
Description: Report lists new member per week/month Selections:
Output: Report shows two charts and one table for new members per week or per month. Columns:
Clarifications: Negative values are marked red. Source:
|
| Anchor | ||||
|---|---|---|---|---|
|
| Expand | ||
|---|---|---|
| ||
Based on report 0107, but uses SQL instead of MDX Descriptions: Report lists loyalty club sales for selected stores depending on loyalty program and team. Selections:
Relevant parameters:
Output:
Columns:
Clarifications: Customer club refers to LoyaltyProgramKey and Employees refers to CustomerGroupKey. Gross profit is a value referred to NetCost deducted from NetAmount. Source:
|
| Anchor | ||||
|---|---|---|---|---|
|
| Expand | ||
|---|---|---|
| ||
CO: 154926 Description: Report lists cashiers statistics for selected stores. Selections:
Output: One page per store. Report has a summary for each column at the end each store's table. Columns:
Source:
|
| Anchor | ||||
|---|---|---|---|---|
|
| Expand | ||
|---|---|---|
| ||
RTC-27636 / CO-222611 Description: Report shows information about issued, redeemed and balance for bonus checks, per month and store for the last 12 months. Selections:
Output: One page per store. For each month sum of issued, redeemed, balance and expired bonus checks. One sum for manual issued checks, checks issued from sales and total. First page of report is total for all stores. Columns:
Sorting:
Source:
|
| Anchor | ||||
|---|---|---|---|---|
|
| Expand | ||
|---|---|---|
| ||
Description: Report lists accounts receivable invoice aging. Selections:
Output: Report has a total summary at the end of table Columns:
Source:
|
| Anchor | ||||
|---|---|---|---|---|
|
| Expand | ||
|---|---|---|
| ||
Description: Report lists invoice journal with statistics of them. Selections:
Output: Report print invoice statistics for particular store. Columns:
Interactive sorting: Interactive sorting on columns: Invoice no, Customer num., Invoice date and Due date. Source:
|
| Anchor | ||||
|---|---|---|---|---|
|
| Expand | ||
|---|---|---|
| ||
Description: Report lists invoice journal for AR (based on retail database) Selections:
Output: Report shows credit sales for store in selected period of time. Report has a total summary on each column at the end of table. Columns:
Source:
|
| Anchor | ||||
|---|---|---|---|---|
|
| Expand | ||
|---|---|---|
| ||
Description: Report lists customer list for export Selections:
Output: It's credit sales report based on retail database. Columns:
Source:
|
| Anchor | ||||
|---|---|---|---|---|
|
| Expand | ||
|---|---|---|
| ||
Description: Report shows Customer list, for export to Excel/CSV. Selections:
Output:
Columns:
Source:
|
| Anchor | ||||
|---|---|---|---|---|
|
| Expand | ||
|---|---|---|
| ||
Description: Report shows list of projects. Selections:
Output: Report shows table for every customer in selected store. Every table has summary for customer and total summary for all customers Columns:
Source:
|
| Anchor | ||||
|---|---|---|---|---|
|
| Expand | ||
|---|---|---|
| ||
Description: Report lists customer orders per project Selections:
Output: Report shows two tables: customer table and project tables for customer. Report has summaries for each project for customer. Report has a total summary for all projects. Columns:
Source:
|
| Anchor | ||||
|---|---|---|---|---|
|
| Expand | ||
|---|---|---|
| ||
Description: Report list of customer orders, with order lines, per project per customer Selections:
Output: Report shows a lot of tables divided on customer and his receipt. Each receipt has a column with purchased items. All receipt tables are under table with customer details. Columns:
Source:
|
| Anchor | ||||
|---|---|---|---|---|
|
| Expand | ||
|---|---|---|
| ||
Description: Report lists credit sales ready for invoicing Selections:
Output: Report shows customer list. Columns:
Interactive sorting: Interactive sorting on all columns. Source:
|
| Anchor | ||||
|---|---|---|---|---|
|
| Expand | ||
|---|---|---|
| ||
Description: Report shows payments for invoices. Selections:
Output: Report lists invoice number, created date and amount for each customer for selected store and date range. Columns:
Source:
|
| Anchor | ||||
|---|---|---|---|---|
|
| Expand | ||
|---|---|---|
| ||
Description: Report lists changed receipts in store. Selections:
Output:
Columns:
Source:
|
| Anchor | ||||
|---|---|---|---|---|
|
| Expand | ||
|---|---|---|
| ||
Description: Report show invoices for receipts that was changed before invoicing Selections:
Output: Report shows tables with customers and their invoice journal with payments. Every table has a summary for each customer and whole report has a total summary for all customers. Columns:
Source:
|
| Anchor | ||||
|---|---|---|---|---|
|
| Expand | ||
|---|---|---|
| ||
Description: Report lists accounts receivable invoice aging with invoice details. Selections:
Output: Report has a table for every customer in store. Every table with customer has a summary at the end of column and there is total summary at the end of report for all customers Columns:
Clarifications: Report has a hidden parameter with selected store number 235. Source:
|
| Anchor | ||||
|---|---|---|---|---|
|
| Expand | ||
|---|---|---|
| ||
Description: Report lists customer sales report without prices. Selections:
Output: Report shows table with customer sales period. For each customer, item groups and subgroup are shown. Columns:
Source:
|
| Anchor | ||||
|---|---|---|---|---|
|
| Expand | ||
|---|---|---|
| ||
Description: Report lists sales for a customer witout showing prices. Selections:
Output: Report shows customer sales statistics without sales. Columns:
Interactive sorting: Interactive sorting on columns: Customer num., Customer, Balance due and Last purchase. Source:
|
| Anchor | ||||
|---|---|---|---|---|
|
| Expand | ||
|---|---|---|
| ||
Description: Report lists of customers without sale since given date Selections:
Output: Report shows unpaid customer orders. Table is divided on each customer and his orders. Columns:
Source:
|
| Anchor | ||||
|---|---|---|---|---|
|
| Expand | ||
|---|---|---|
| ||
Description: Report lists active customer orders that doesn't have status "pay done" on all lines Selections:
Output: Report shows tender per receipts. Report has a total summary at the end of each column. Columns:
Source:
|
| Anchor | ||||
|---|---|---|---|---|
|
| Expand | ||
|---|---|---|
| ||
Description: Report lists receipts with amount per tender Selections:
Output: Report lists all receipts for selected day in selected store. Report has a summary at the end of each column. Columns:
Source:
|
| Anchor | ||||
|---|---|---|---|---|
|
| Expand | ||
|---|---|---|
| ||
Description: Report lists balance in and out, invoices and payments. Selections:
Output: One page per customer. Report has a summary for balance at the end of column. Columns:
Source:
|
| Anchor | ||||
|---|---|---|---|---|
|
| Expand | ||
|---|---|---|
| ||
Description: Report lists stockating waste results as a list. Selections:
Output: Report shows stock waste list, all in one table. Table has department titles and is divided on item groups in departments. Each item group has a summary for all columns. Each department has its own summary for all columns. Table has a total positive waste summary and total negatice waste summary for all departmens at the end of table. Columns:
Source:
|
| Anchor | ||||
|---|---|---|---|---|
|
| Expand | ||
|---|---|---|
| ||
Description: Report lists stockating results as a list. Selections:
Output: Report shows stock list, all in one table. Table has department titles and is divided on item groups in departments. Each item group has a summary for Counted qty and stock value. Each department has its own summary for counted qty and stock value. Table has a total summary for all departmens at the end of table. Columns:
Source:
|
| Anchor | ||||
|---|---|---|---|---|
|
| Expand | ||
|---|---|---|
| ||
Description: Report lists projects and their statistics in selected store. Selections:
Output: Report shows table with printed projects for store and customer. Every project has a summary at the end of its values in columns. Columns:
Source:
|
| Anchor | ||||
|---|---|---|---|---|
|
| Expand | ||
|---|---|---|
| ||
Description: Report lists balance and usage of giftcards. Selections:
Output: Report has a total summary at the end of each column. Columns:
Source:
|
| Anchor | ||||
|---|---|---|---|---|
|
| Expand | ||
|---|---|---|
| ||
Description: Report shows balance and usage of giftcards and credit notes, down to transaction level. Selections:
Output:
Columns:
Clarifications: After expanding drilldown on redeemed store, giftcard numbers and transaction dates are appearing. Source:
|
| Anchor | ||||
|---|---|---|---|---|
|
| Expand | ||
|---|---|---|
| ||
Description: Report lists acciunts receivable invoice aging with invoice details. Selections:
Output: Reports shows invoice details for customers in stores. Report has a total summary at the end of table. Columns:
Source:
|
| Anchor | ||||
|---|---|---|---|---|
|
| Expand | ||
|---|---|---|
| ||
Description: Report lists credit sales for invoicing multiple stores. Selections:
Output: Report has a total summary for amount column at the end of table. Columns:
Source:
|
| Anchor | ||||
|---|---|---|---|---|
|
| Expand | ||
|---|---|---|
| ||
Description: Report lists current prices from POS Master. Selections:
Output: Report shows all items with EAN from POS Master with their prices Columns:
Source:
|
| Anchor | ||||
|---|---|---|---|---|
|
| Expand | ||
|---|---|---|
| ||
Description: Report lists error from POS Import. Selections:
Output: Report shows all errors with time, message and details from POS Import Columns:
Source:
|
| Anchor | ||||
|---|---|---|---|---|
|
| Expand | ||
|---|---|---|
| ||
Description: Report lists erors from POS staging import Selections:
Output: Report shows all errors from POS Staging import Columns:
Source:
|
| Anchor | ||||
|---|---|---|---|---|
|
| Expand | ||
|---|---|---|
| ||
Description: Report lists stock value control Selections:
Output: Report shows stock value control for all articles. Columns:
Source:
|
| Anchor | ||||
|---|---|---|---|---|
|
| Expand | ||
|---|---|---|
| ||
Description: Report lists stock values to control items. Selections:
Output: Report calculates and checks stock value based on initial stock value and transactions, for all EAN. Columns:
Clarifications: Report has red font values if values in difference column don’t equal zero. Source:
|
| Anchor | ||||
|---|---|---|---|---|
|
| Expand | ||
|---|---|---|
| ||
Description: Report lists chas registers that have not replicated all changes. Selections:
Output: Report shows all cash registers without any selections. Columns:
Source:
|
...
| Expand | ||
|---|---|---|
| ||
Description: Report allows to follow up article sales on multiple levels with possibility to select specific hourly intervals and exclude specific item groups. Selections:
Output: Article sale statistics for selected stores, for selected date interval and for selected time interval grouped by department, area and group. By default data is shown for department and it is possible to drill down to item level manually by clicng plus button or by using expand all button to expand everithing to item level at once. Columns:
Sorting:
Clarifications:
Source: Lindbak POS Reporting cube (OLAP) |
...
| Expand | ||
|---|---|---|
| ||
Description: Report allows to find given number of best or worst selling items on multiple levels (amount, quantity, gross profit) in two date intervals. Possible to select specifit hourly interval. Selections:
Output: Sale statistics for selected number of best or worst items per store sorted by selected sort measure devided in two selected date intervals. Columns: Sorting: Clarifications: Source: Lindbak POS Reporting cube (OLAP) |

