...
| Expand |
|---|
| title | 0721_StoreSettlementPerWorkstation |
|---|
|

Description: Report allows to follow up store settlement: on first page settlement for all selected workstations and settlement per each workstation on following pages. Report is divided in 15 subreports which will be descriped separatly below. Selections (applies to all subreports): - Date from: Default today
- Date to: Default today
- Store: Single value; default first available from the list.
- Workstation: Multivalue; default all
Subreports:
| Expand |
|---|
| 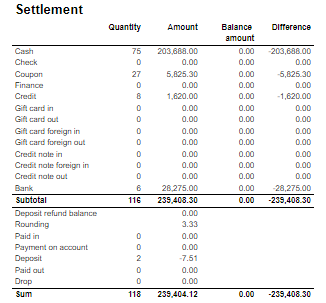
Columns: - Quantity
- Amount
- Balance amount
- Difference: Balance amount - Amount
Rows: One row per tender type . In means received, out means given (returns etc...) - Cash: Tender type key = Cash or CashBack
- Check
- Coupon
- Finance
- Credit
- Gift card in
- Gift card out
- Gift card foreign in
- Gift card foreign out
- Credit note in
- Credit note foreign in
- Credit note out
- Bank: Tender Type Key = CreditDebit or CreditDebitOffline or ECreditDebit
- Subtotal: Total for all rows above Subtotal
______________________________________________________________________________________ - Deposit refound balance: Tender type key DepositRefund received - DepositRefund given
- Rounding: Subtotal rounding
- Paid in: Tender Control Type Key: PayedIn
- Payment on account: Tender Control Type Key: PaymentOnAccount
- Deposit: Article Type Key: Deposit
- Paid out: Tender Control Type Key: PayedOut
- Drop: Tender Control Type Key: Drop
|
| Expand |
|---|
| title | 1005_subDepositRefund |
|---|
| 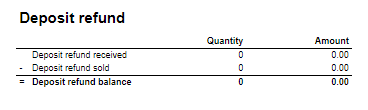
Columns: - Amount: Sales amount inc. VAT
- Qunatity: Number of receipts.
Rows: - Deposit refund received: Amount (or number of receipts) for direction in for Article Type Key: DepositRefund
- Deposit refund sold: Amount (or number of receipts) for direcion out for Article Type Key: DepositRefund
- Deposit refund balance: Received - sold
|
| Expand |
|---|
| 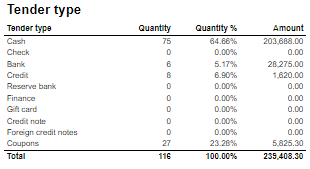
Columns: - Qunatity
- Qunatity %: Share of given tender type quantity in whole quantity
- Amount: Sales inc. VAT per tender type
Rows: - One row per one tender type
|
| Expand |
|---|
| 
Columns: - Paymentcard – Type of paymentcard
- Quantity – Tender count
- Amount – Tender amount
Output: - Subreport lists one row per type of payment card.
- Table has a total summary quantity and amount for all payment cards.
|
| Expand |
|---|
| title | 1008_subSettlement_2 |
|---|
| 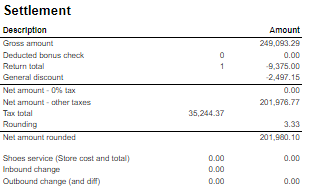
Rows: - Gross amount: Amount inc. VAT + General discount - Returns
- Deducted bonus check: Return amount on article group set in hidden parameter: pBonusCheckArticleGroup
- Return total: All rerutns amount - Deducted bonus check
- General discount: Discount amount with keys: Line and Subtotal
__________________________________________________________________________________ - Net amount - 0% tax: Net amount with 0% tax
- Net amount - other taxes: Net amount
- Tax total: tax amount
- Rounding: Subtotal rounding amount
__________________________________________________________________________________ - Net amount rounded: both Net amounts + Rounding
- Shoes serviece (Store cost and total): balance amount with tender type: InboundChangeBalance; Sales inc. VAT per article with article type: Service
- Inbound change: Return amount per article with article type: Service
- Outbound change: Remaining Amoun tIn Drawer; difference: Remaining Amoun tIn Drawer - balance amount with tender type: InboundChangeBalance
|
| Expand |
|---|
| title | 1000_subArticleSales |
|---|
| 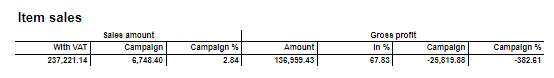
Columns: - Sales amount With VAT:
- Sales amount Campaign: Sale amount inc. VAT for campaigns with discount keys: CampaignPrice, Group, MemberPrice
- Sales amount campaign %: Share of campain sales in all sales (Sales amount Campaign / Sales amount With VAT)
- Gross profit Amount
- Gross profit In %: Share of Gross profit in Net Amount
- Gross profit Campaign: Gross profit for Campaign
- Gross profit Campaign %: Share of gross profit for campains in campaign sales (Gross profit Campaign/ Sales amount Campaign)
Rows: |
| Expand |
|---|
| title | 1012_subTaxAccounting |
|---|
| 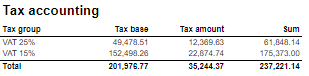
Columns: - Tax group: tax type
- Tax base: Net amount
- Tax amount: tax
- Sum: Turnover inc. VAT
Rows: |
| Expand |
|---|
| 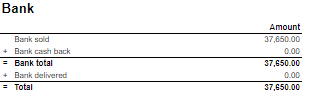
Rows: - Bank sold: Sales amount for tender types: CreditDebit, CreditDebitOffline, ECreditDebit
- Bank cash back: tender type Cash back
- Bank delivered: tender type: DeliveredBalance
|
| Expand |
|---|
| title | 1003_subBankSettlement |
|---|
| 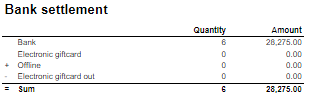
Rows: - Bank: Amount for tender types: CreditDebit, CreditDebitOffline, ECreditDebit, Cash back
- Electronic giftcard: Amount for few hard coded payment card keys
- Offline: Amount for CreditDebitOffline
- Electronic giftcard out: Outcoming amount for few hard coded payment card keys
|
| Expand |
|---|
| 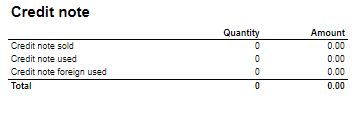
Rows: - Credit note sold: Quantity/ Amount of sold by store credit notes
- Credit note used: Credit notes used in the store
- Credit note foreign used: Foreign credit notes used in the store
|
| Expand |
|---|
| 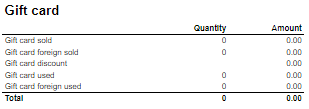
Columns: - Quantity: number of gift cards
- Amount: Amount on gift cards
Rows: - Gift Card sold: Gift cards sold by given operator in given store
- Gift card foreign sold: Foreign gift cards sold by given operator in given store
- Gift card discount
- Gift card used: Sales amount inc. VAT made with gift cards. (Number of transactions made with gift cards)
- Gift card foreign used: Sales amount inc. VAT made with foreign gift cards. (Number of transactions made with foreign gift cards)
|
| Expand |
|---|
| 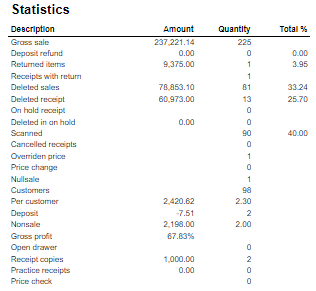
Rows: - Gross sale amount: Amount inc. VAT
Total%: - Deposit refund: Deposit refound amount / Gross sale amount
- Returned items: Returned items amount/ Gross sale amount
- Deleted sales: Deleted amount/ Gross sale amount
- Deleted reciept: Deleted receipts amount/ Gross sale amount
- Scanned: Scanned quantity/ Gross sale qunatity
|
| Expand |
|---|
| 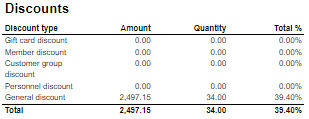
Columns: - Amount: Discount amount
- Quantity: quantity of items sold with given discount
- Total %: Share of given discount amount in all discounts amount
Rows: - One row per one type of discount
|
| Expand |
|---|
| title | 1014_subReturnReasonCodes |
|---|
| 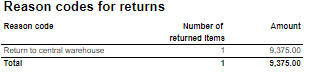
Description: Amount inc. VAT and quantity of items returned. One row per reason code. |
| Expand |
|---|
| 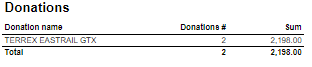
Description: Nonsale Amount and number of transactions per article. Clarification: Articles to displayed can be narrowed down by changing parameter: pArticlesSet |
Source: - Lindbak POS Reporting cube (OLAP)
|
| Anchor |
|---|
| 07500722_WetStockStoreSettlementPerOperatorAlt0750 |
|---|
| 0722_WetStockStoreSettlementPerOperatorAlt |
|---|
|
| Expand |
|---|
| title | 0750_WetStock | 0722_StoreSettlementPerOperatorAlt |
|---|
|
Standard report  Image Added Image Added Image Removed Image Removed
Description: Report lists wet stock in stores.Selections: - Date from – Default first day of current month
- Date to – Default last day of current month
- Retail store – Default all
Output: Each selected store has own table and total summary at the end of table. Columns: - Date
- Opening stock – Actual stock from reading
- Deliveries – Delivery quantity
- Sales – Sales quantity
- Adjustments – Adjustments quantity
- Book Stock – Opening stock and Deliver quantity without sales and adjustment quantity
- Actual Stock
- Water
- Daily Variance
- Daily Variance %
- 5 day cumulative / 31 days cumulative Variance
- Sales
- Variance %
Clarifications: Variance percentage will be red when value different than zero. Source: - Lindbak POS Reporting Cube (OLAP)
|
...
 Image Removed
Description:
Report lists daily wet stock
Selections:
- Date from – Default first day of current month
- Date to – Default last day of current month
- Retail store – Default select a single store
- Article – Default all
Output:
Report shows list of fuel tank groups with article name in each group. One page per fuel tank group.
Columns:
- Date – Date of stock
- Opening stock
- Deliveries – Deliveries quantity
- Sales – Sales quantity
- Adjustments – Adjustments quantity
- Book Stock
- Actual Stock
- Water – Water quantity
- Daily Variance – Daily Variance difference
- Daily Variance % - Daile variance difference percentage
- Cumulative Variance
- Cumulative Sale – Cumulative sale quantity
- Cumulative Variance %
Source:
- Lindbak POS Reporting Cube (OLAP)
...
| title | 0752_SalesStatistics |
|---|
CO based on report 0714
 Image Removed
 Image Removed
Description:
Report allows to follow up article sales on multiple levels with possibility to select specific hourly intervals and exclude specific item groups.
Selections:
- Date from - Default today
- Date to - Default today
- Hour from - Default 0:00
- Hour to - Default 24:00
- Team - Default all
- Store - Default all
- Department - Default all
- Article area - Default all
- Article group - Default all
- Include VAT - Default on
- Exclude groups - Default false
- Excluded groups - Appears when Exclude groups is switched to true
Output:
Article sale statistics for selected stores, for selected date interval and for selected time interval grouped by department, area and group.
By default data is shown for department and it is possible to drill down to item level manually by clicng plus button or by using expand all button to expand everithing to item level at once.
Columns:
- Buttons for expanding and collapsing all drilldowns.
- EAN - EAN code
- Item name - Article name
- Quantity
- Total- Quantity sold
- Turnover inc. VAT or Turnover ex. VAT depending on selection.
- Total - Amount sold. Inc. or ex. VAT depending on selection
- Share - Share of this department / area / group / item related to total sale.
- Cost price - Cost price
- Gross profit
- Total - Gross profit amount
- Total % - Gross profit percentage.
Sorting:
- Department number
- Item Area number
- Item Group number
- EAN
Clarifications:
- Hour selection applies to each day in selected date period
Article group list is narrowed by selecting article areas. By preventing problems with Excluded groups parameter, report will set all article groups in ExludedGroups (parameter is hidden and switched off until set true by user) if default groups in pExcludedGroupsList are not contain in previously selected article area. If user change article area and want set true on Exclude groups which not containg default groups to exclude, user have to manually choose new article groups to exclude, instead of all selected.
Hidden parameters:
pExcludedGroupsList – Report contain hidden parameter with selected article groups to be exluded by default. This parameter and pExcludedGroups will not work until parameter pExludeGroups will be set as True by user.
Source:
- Lindbak POS Reporting cube (OLAP)
...
| title | 0753_SalesPerHourForArticle |
|---|
CO-196622, RTC-18368
 Image Removed
Description:
Report lists turnover per hour for articles in comparison to last year.
Selections:
- Date from – Default today
- Date to – Default today
- Date from LY – Default last year from today
- Date to LY – Default last year from today
- Team – Default all
- Store -Default all
- Area – Default all
- Department – Default all
- Article group – Default all
- Aggregated values – Default false
- EAN list – Default empty
Output:
- Report has shows data for all stores together at the beginning and one page per store. Report has a summary at the end of table report for each column and total summary for second table with aggregated values.
- Report has two bar charts: turnover per hour and total turnover with compared bars. On x-axis is respectively each hour and whole slected date. On y-axis is sales amount in time.
Columns:
- Hour – Hour of a day
- Quantity
- Turnover
- Share
- Gross profit
- Gr. prof. % - Gross profit percentage
- Diff. qty. – Difference quantity
- Diff. sales – Difference sales
- Diff. GP % - Difference gross profit percentage
Source:
- Lindbak POS Reporting Cube (OLAP)
...
| title | 0754_TopSalesPerItemWithCompareDate |
|---|
 Image Removed
Description:
Report lists top sales statistics per item with compare date.
Selections:
- Date from – Default today
- Date to – Default today
- Compare date from – Default last year from today
- Compare dat to – Default last year from today
- Hour from – Default 0:00
- Hour to – Default 24:00
- Team – Default all
- Stores – Default all
- Department – Default all
- Article area – Default all
- Article group – Default all
- Grouping – Default Depertment
- Number of items – Default 10 items
- Sorting – Default by best
- Vendor – Default all
- Subvendor – Default all
- Measure - Defualt by amount
- EAN list - Default empty
- Include VAT – Default false
- Exclude groups - Default false
- Excluded groups – Default groups 2 and 92. Appears when Exclude groups is switched to true
Output:
Report shows table for all store on the beginning and one store table per page. Report has a summary for each table at the end of columns.
Columns:
- Dept. – Department
- Area – Article area
- Grp. – Article group
- EAN
- Brand
- Item name
- Selected period of time/Comparable period of time
- Quantity
- Turnover ex. VAT – Turnover excluding VAT
- Gross profit
- Gr. prof. % - Gross profit percentage
- Num of receipts – Number of receipts
Clarifications:
- Negative values are marked red.
- Article group list is narrowed by selecting departments and article areas. By preventing problems with Excluded groups parameter, report will set all article groups in ExludedGroups (parameter is hidden and switched off until set true by user) if default groups in pExcludedGroupsList are not contain in previously selected department or article area. If user change department or article area and want set true on Exclude groups which not containg default groups to exclude, user have to manually choose new article groups to exclude, instead of all selected.
Hidden parameters:
- pExcludedGroupsList – Report contain hidden parameter with selected article groups to be exluded by default. This parameter and pExcludedGroups will not work until parameter pExludeGroups will be set as True by user.
- pAccumulation – Parameter with Values Total and Store (default vaule is total). If default value is store, all stores are selected.
Source:
- Lindbak POS Reporting Cube (OLAP)
- Lindbak POS Reporting DW
allows to follow up store settlement: on first page settlement for all selected cashiers (if all cashiers are selected it equals whole store settlement) and settlement per each cashier on following pages. Report is divided in 12 subreports which will be descriped separatly below. Selections (applies to all subreports): - Date from: Default today
- Date to: Default today
- Store: Single value; default first available from the list.
- Operator: Multivalue; default all
- Price channels: Multivalue; default all
Subreports:
| Expand |
|---|
| title | 1023_subSettlementAlt |
|---|
| 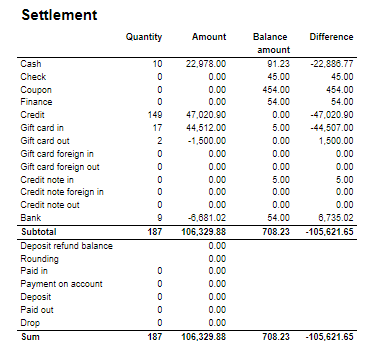 Image Added Image Added
Columns: - Quantity
- Amount
- Balance amount
- Difference: Balance amount - Amount Excluding Bank row from calculation
Rows: One row per tender type . In means received, out means given (returns etc...) - Cash: Tender type key = Cash or CashBack
- Check
- Coupon
- Finance
- Credit
- Gift card in
- Gift card out
- Gift card foreign in
- Gift card foreign out
- Credit note in
- Credit note foreign in
- Credit note out
- Bank: Tender Type Key = CreditDebit or CreditDebitOffline or ECreditDebit
- Subtotal: Total for all rows above Subtotal
______________________________________________________________________________________ - Deposit refound balance: Tender type key DepositRefund received - DepositRefund given
- Rounding: Subtotal rounding
- Paid in: Tender Control Type Key: PayedIn
- Payment on account: Tender Control Type Key: PaymentOnAccount
- Deposit: Article Type Key: Deposit
- Paid out: Tender Control Type Key: PayedOut
- Drop: Tender Control Type Key: Drop
|
| Expand |
|---|
| title | 1005_subDepositRefound |
|---|
| Image Added Columns: - Amount: Sales amount inc. VAT
- Qunatity: Number of receipts.
Rows: - Deposit refund received: Amount (or number of receipts) for direction in for Article Type Key: DepositRefund
- Deposit refund sold: Amount (or number of receipts) for direcion out for Article Type Key: DepositRefund
- Deposit refund balance: Received - sold
|
| Expand |
|---|
| 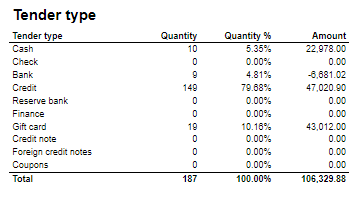 Image Added Image Added
Columns: - Qunatity
- Qunatity %: Share of given tender type quantity in whole quantity
- Amount: Sales inc. VAT per tender type
Rows: - One row per one tender type
|
| Expand |
|---|
| Image Added Columns: - Paymentcard – Type of paymentcard
- Quantity – Tender count
- Amount – Tender amount
Output: - Subreport lists one row per type of payment card.
- Table has a total summary quantity and amount for all payment cards.
|
| Expand |
|---|
| 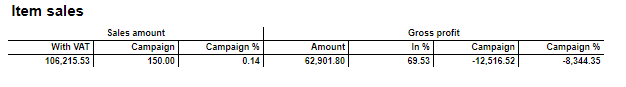 Image Added Image Added
Columns: - Sales amount With VAT:
- Sales amount Campaign: Sale amount inc. VAT for campaigns with discount keys: CampaignPrice, Group, MemberPrice
- Sales amount campaign %: Share of campain sales in all sales (Sales amount Campaign / Sales amount With VAT)
- Gross profit Amount
- Gross profit In %: Share of Gross profit in Net Amount
- Gross profit Campaign: Gross profit for Campaign
- Gross profit Campaign %: Share of gross profit for campains in campaign sales (Gross profit Campaign/ Sales amount Campaign)
Rows: |
| Expand |
|---|
| title | 1012_subTaxAccounting |
|---|
| 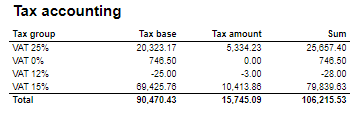 Image Added Image Added
Columns: - Tax group: tax type
- Tax base: Net amount
- Tax amount: tax
- Sum: Turnover inc. VAT
Rows: |
| Expand |
|---|
| 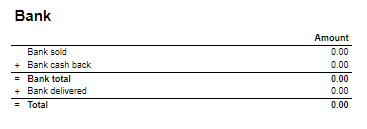 Image Added Image Added
Rows: - Bank sold: Sales amount for tender types: CreditDebit, CreditDebitOffline, ECreditDebit
- Bank cash back: tender type Cash back
- Bank delivered: tender type: DeliveredBalance
|
| Expand |
|---|
| title | 1003_subBankSettlement |
|---|
| 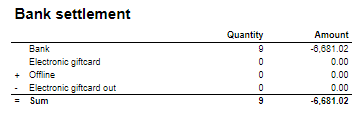 Image Added Image Added
Rows: - Bank: Amount for tender types: CreditDebit, CreditDebitOffline, ECreditDebit, Cash back
- Electronic giftcard: Amount for few hard coded payment card keys
- Offline: Amount for CreditDebitOffline
- Electronic giftcard out: Outcoming amount for few hard coded payment card keys
|
| Expand |
|---|
| Image Added Rows: - Credit note sold: Quantity/ Amount of sold by store credit notes
- Credit note used: Credit notes used in the store
- Credit note foreign used: Foreign credit notes used in the store
|
| Expand |
|---|
| 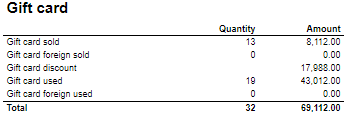 Image Added Image Added
Columns: - Quantity: number of gift cards
- Amount: Amount on gift cards
Rows: - Gift Card sold: Gift cards sold by given operator in given store
- Gift card foreign sold: Foreign gift cards sold by given operator in given store
- Gift card discount:
- Gift card used: Sales amount inc. VAT made with gift cards. (Number of transactions made with gift cards)
- Gift card foreign used: Sales amount inc. VAT made with foreign gift cards. (Number of transactions made with foreign gift cards)
|
| Expand |
|---|
|  Image Added Image Added
Rows: - Gross sale amount: Amount inc. VAT
Total%: - Deposit refund: Deposit refound amount / Gross sale amount
- Returned items: Returned items amount/ Gross sale amount
- Deleted sales: Deleted amount/ Gross sale amount
- Deleted reciept: Deleted receipts amount/ Gross sale amount
- Scanned: Scanned quantity/ Gross sale qunatity
|
| Expand |
|---|
| 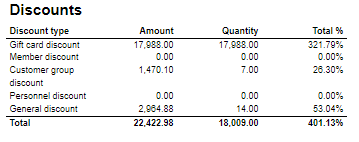 Image Added Image Added
Columns: - Amount: Discount amount
- Quantity: quantity of items sold with given discount
- Total %: Share of given discount amount in all discounts amount
Rows: - One row per one type of discount
|
Source: - Lindbak POS Reporting cube (OLAP)
|
| Anchor |
|---|
| 0750_WetStock |
|---|
| 0750_WetStock |
|---|
|
| Expand |
|---|
|
Image Added Description: Report lists wet stock in stores. Selections: - Date from – Default first day of current month
- Date to – Default last day of current month
- Retail store – Default all
Output: Each selected store has own table and total summary at the end of table. Columns: - Date
- Opening stock – Actual stock from reading
- Deliveries – Delivery quantity
- Sales – Sales quantity
- Adjustments – Adjustments quantity
- Book Stock – Opening stock and Deliver quantity without sales and adjustment quantity
- Actual Stock
- Water
- Daily Variance
- Daily Variance %
- 5 day cumulative / 31 days cumulative Variance
- Sales
- Variance %
Clarifications: Variance percentage will be red when value different than zero. Source: - Lindbak POS Reporting Cube (OLAP)
|
| Anchor |
|---|
| 0751_DailyWetStock |
|---|
| 0751_DailyWetStock |
|---|
|
| Expand |
|---|
|
Image Added Description: Report lists daily wet stock Selections: - Date from – Default first day of current month
- Date to – Default last day of current month
- Retail store – Default select a single store
- Article – Default all
Output: Report shows list of fuel tank groups with article name in each group. One page per fuel tank group. Columns: - Date – Date of stock
- Opening stock
- Deliveries – Deliveries quantity
- Sales – Sales quantity
- Adjustments – Adjustments quantity
- Book Stock
- Actual Stock
- Water – Water quantity
- Daily Variance – Daily Variance difference
- Daily Variance % - Daile variance difference percentage
- Cumulative Variance
- Cumulative Sale – Cumulative sale quantity
- Cumulative Variance %
Source: - Lindbak POS Reporting Cube (OLAP)
|
| Anchor |
|---|
| 0752_SalesStatistics |
|---|
| 0752_SalesStatistics |
|---|
|
| Expand |
|---|
| title | 0752_SalesStatistics |
|---|
|
CO based on report 0714 Image Added Image Added Description: Report allows to follow up article sales on multiple levels with possibility to select specific hourly intervals and exclude specific item groups |
...
| Expand |
|---|
| title | 0755_TopSalesPerItem |
|---|
|
CO: 207212. Based on report 0754  Image Removed Image Removed
Description: Report allows to find given number of best or worst selling items on multiple levels (amount, quantity, gross profit) in two date intervals. Possible to select specific hourly interval. Selections: - Date from - Default today
- Date to - Default todayCompare date from - Default the same day of week as Date from year before
- Compare date to- Default the same day of week as Date to but year before
- Hour from - Default 0:00
- Hour to - Default 24:00
- Team - Default all
- Store - Default all
- Department - Default all
- Article area - Default all
- Article group - Default all
- Number of items - Number of best or worst items to display - default 10
- Sort type - worst or best - report will display given number of worst or best selling items - default best
- Sort measure - amount/quantity/net cost/gross profit/gross profit % - set the measure on which the items are sorted. - default amount
- Vendor - default all
- Subvendor- default all
- Include VAT - Default on
- Include VAT - Default on
- Exclude Exclude groups - Default false
- Excluded groups - Appears when Exclude groups is switched to true
Output:Sale Article sale statistics for selected number of best or worst items per store sorted by selected sort measure devided in two selected date intervals in selected hour rangestores, for selected date interval and for selected time interval grouped by department, area and group. By default data is shown for department and it is possible to drill down to item level manually by clicng plus button or by using expand all button to expand everithing to item level at once. Columns: - Buttons for expanding and collapsing all drilldowns.
- EAN - EAN code
- Item name - Article
- Store
- Dept. - Department
- Area
- Grp. - Item group
- EAN
- Item name
- Quantity
- Total- Quantity sold
- Turnover inc. VAT or Turnover ex. VAT depending on selection.
- Total - Amount sold. Inc. or ex. VAT depending on selection
- Share - Share of this department / area / group / item related to total sale.
- Cost price - Cost price
- Gross profit
- Total - Gross profit %amount
- Total % - Gross profit percentage.Num of receipts
Sorting: - Department number
- Item Area number
- Item Group number
- EANSelected sort measure
Clarifications: - Hour selection applies to each day in selected date period
- Negative values are colored red
Article group list is narrowed by selecting departments and article areas. By preventing problems with Excluded groups parameter, report will set all article groups in ExludedGroups (parameter is hidden and switched off until set true by user) if default groups in pExcludedGroupsList are not contain in previously selected department or article area. If user change department or article area and want set true on Exclude groups which not containg default groups to exclude, user have to manually choose new article groups to exclude, instead of all selected.
Hidden parameters: Source: - Lindbak POS Reporting cube (OLAP)
- Lindbak POS Reporting DW
|
| Anchor |
|---|
| 07560753_CreditSalesWithPaymentsOnAccountSalesPerHourForArticle0756 |
|---|
| 0753_CreditSalesWithPaymentsOnAccountSalesPerHourForArticle |
|---|
|
| Expand |
|---|
| title | 07560753_CreditSalesWithPaymentsOnAccountSalesPerHourForArticle |
|---|
|
CO: 208778. Based on report 0650 -196622, RTC-18368 Image Added Image Removed Image Removed Description: Report shows credit sales and payments on account to get a better overview over drive-offslists turnover per hour for articles in comparison to last year. Selections: - Default - – Default today
- Date to – Default today
- Date from LY – Default last year from today
- Date to
- - LY – Default last year from today
- Team – Default all
- Store -Default all
- Area – Default all
Retail store - Default all available in selected teamOutput: One row per transaction grouped by store and customer. Page break and total for each store. Columns: - Date - date of the transaction,
- Receipt - receipt number of the transaction,
- Ref.no - reference number of the credit tender transaction,
- Ref.text - reference text of the credit tender transaction,
- Amount - amount inc. VAT of the credit tender transaction,
- Tax amount - VAT amount from articles,
- On account - payments when using payment on account function in POS.
Sorting: - Store number
- Customer key
- Transaction date
Clarifications: Transaction can be either Credit sale or Payment on account. If transaction is Payment on account there is no data available for columns: Ref.no and Ref.text Source: |
...
- Department – Default all
- Article group – Default all
- Aggregated values – Default false
- EAN list – Default empty
Output: - Report has shows data for all stores together at the beginning and one page per store. Report has a summary at the end of table report for each column and total summary for second table with aggregated values.
- Report has two bar charts: turnover per hour and total turnover with compared bars. On x-axis is respectively each hour and whole slected date. On y-axis is sales amount in time.
Columns: - Hour – Hour of a day
- Quantity
- Turnover
- Share
- Gross profit
- Gr. prof. % - Gross profit percentage
- Diff. qty. – Difference quantity
- Diff. sales – Difference sales
- Diff. GP % - Difference gross profit percentage
Source: - Lindbak POS Reporting Cube (OLAP)
|
| Anchor |
|---|
| 0754_TopSalesPerItemWithCompareDate |
|---|
| 0754_TopSalesPerItemWithCompareDate |
|---|
|
| Expand |
|---|
| title | 0754_TopSalesPerItemWithCompareDate |
|---|
|
Image Added Description: Report lists top sales statistics per item with compare date |
...
| Expand |
|---|
|
 Image Removed Image Removed
Description: Reports lists mix coupons for selected stores in selected period of time. Selections: - Date from - – Default today
- Date to - Default today
- Profile - Default all
- Team - Default all
- Store - Default all
- – Default today
- Compare date from – Default last year from today
- Compare dat to – Default last year from today
- Hour from – Default 0:00
- Hour to – Default 24:00
- Team – Default all
- Stores – Default all
- Department – Default all
- Article area – Default all
- Article group – Default all
- Grouping – Default Depertment
- Number of items – Default 10 items
- Sorting – Default by best
- Vendor – Default all
- Subvendor – Default all
- Measure - Defualt by amount
- EAN list - Default empty
- Include VAT – Default false
- Exclude groups - Default false
- Excluded groups – Default groups 2 and 92. Appears when Exclude groups is switched to trueMix - Default all
Output: Report shows extended mixmatch sales statistics. For one page per store there is a list grouped by mixtable for all store on the beginning and one store table per page. Report has a total summaty summary for each table at the end of tablecolumns. Columns: - Dept. – Department
- Area – Article area
- Grp. – Article groupMix - Mix number and mix name
- EAN
- Brand
- Item name
- Department
- Item area
- Item group
- % of total sales - Percentage of total turnover excluding VAT
- Items sold - Number of items sold in mix
- % items sold - Percetnage of item sold in mix
- Discount ex. VAT - Mix discounts excluding VAT
- Receipts with mix
- Share mix receipts - Share of mix receipts
- Amount in mix receipts ex. VAT - Amount in mix receipts excluding VAT
- Avg. sales customer - Average sales customer
- Selected period of time/Comparable period of time
- Quantity
- Turnover ex. VAT – Turnover excluding VAT
- Gross profitGr. prof. % mix - Gross profit percentage mix
- Gr. prof. % total - Gross profit percentage totalGross profit
- Num of receipts – Number of receipts
Clarifications: Report has a star explanation for a few columns. It means that summary values for particular mix are calculated including all transactions in store. As an example '% Items sold' is calculating by taking quantity and dividing it by whole store quantity. For whole mix it will be store quantity of all items in store. For particular article in that mix '% Items sold', quantity of that product in mix will be divided by all articles in that mix. Summary for mix (grey grouped row) takes whole statistics about store, even if it is not mix. Source: - Lindbak POS Reporting Cube (OLAP)
|
...
- Negative values are marked red.
- Article group list is narrowed by selecting departments and article areas. By preventing problems with Excluded groups parameter, report will set all article groups in ExludedGroups (parameter is hidden and switched off until set true by user) if default groups in pExcludedGroupsList are not contain in previously selected department or article area. If user change department or article area and want set true on Exclude groups which not containg default groups to exclude, user have to manually choose new article groups to exclude, instead of all selected.
Hidden parameters: - pExcludedGroupsList – Report contain hidden parameter with selected article groups to be exluded by default. This parameter and pExcludedGroups will not work until parameter pExludeGroups will be set as True by user.
- pAccumulation – Parameter with Values Total and Store (default vaule is total). If default value is store, all stores are selected.
Source: - Lindbak POS Reporting Cube (OLAP)
- Lindbak POS Reporting DW
|
| Anchor |
|---|
| 0755_TopSalesPerItem |
|---|
| 0755_TopSalesPerItem |
|---|
|
| Expand |
|---|
| title | 0755_TopSalesPerItem |
|---|
|
CO: 207212. Based on report 0754 Image Added Description: Report allows to find given number of best or worst selling items on multiple levels (amount, quantity, gross profit) in two date intervals. Possible to select specific hourly interval. Selections: - Date from - Default today
- Date to -
|
...
| Expand |
|---|
|
CO-271850 based on 0603_SalesPerHour  Image Removed Image Removed
Description: Report lists sales per hour with counting customer inside and outside. It also compares inside / outside data with selected period. Selections: - Periode – default month
- Year – Default current year
- Month – Default current month
- Week – Default current week
- Date from – Default today
- Date to – Default today
- Compare date from - Default yesterday.the same day of week as Date from year before
- Compare date to- Default yesterday.
- Profile – Default all
- the same day of week as Date to but year before
- Hour from - Default 0:00
- Hour to - Default 24:00
- Team - Team – Default all
- Store – - Default all
- Exclude groups – Default false
- Excluded groups – Default list of excluded groups
Parameters: - pExcludedGroupsList - Parameter to create list of itemgroups to use in excluded groups selection (<name>;<itemgroupnumber>,<name>;<itemgroupnumber>). Default = Bilvask;93
- pPriceChannelIn - Parameter to define pricechannel for inside customers. Default = [Price Channel].[Price Channel Key].&[Cashier]
- pPriceChannelOut - Parameter to define pricechannel for outside customers. Default = [Price Channel].[Price Channel Key].&[ShopAndGoCheckTerminal]
- pHourFrom and pHourTo - Parameters to define which hours should be shown in report. Default 0 - 23.
Output: - Report has a summary at the end of table on each column.
- Summary totals in the beginning of new hierarchy level for store.
Columns: - Hour – Hour of a day
- Sales – Sales amount
- Net cost
- VAT – VAT amount
- Gr. prof. % - Gross profit percentage
- Share
- Items – Sales quantity
- Quantity - Customer inside/Customer outside quantity for period and comparison period
- Sale per customer - Customer inside/Customer outside sale per customer for period and comparison period
- Sales/item – Sales amount divided by item quantity Items per customer
- Items per customer
- Sales – Campaign sales amount
- Items – Campaign item quantity
- Customers – Campaign customer count
Source: - Lindbak POS Reporting DW
- Lindbak POS Reporting Cube (OLAP)
|
...
| title | 0759_SalesAnalysisWithComparisonAndDrilldown |
|---|
CO-211507 / RTC-45144
 Image Removed
Description:
Report shows sales statistics in a hierarchy from store to department, item area, item group and item. Report show statistics for all selected stores and a total page for all selected store.
Selections:
- Date from – Default today
- Date to – Default today
- Compare date from – Default last year from today
- Compare dat to – Default last year from today
- Hour from – Default 0:00
- Hour to – Default 24:00
- Team – Default all
- Stores – Default all
- Department – Default all
- Article area – Default all
- Article group – Default all
- Vendor – Default all
- Subvendor – Default all
- EAN list - Default empty
- Include VAT – Default false
- Exclude groups - Default false
- Excluded groups – Default groups 2 and 92. Appears when Exclude groups is switched to true
Output:
One line per item with the hierarchy from store, department, item area and item group.
Columns:
- EAN - Shows the entire hierchy down to EAN
- Item name - Item name
- Item num. - Item number
- Share - Percentage share of sales
- Sales - Sales amount
- Compared ex. VAT – Compared sales excluding VAT
- Diff % - Difference percentage between sales and compared sales
- Gross profit amt. – Gross profit amount Compared gross profit
- Gross profit % - Gross profit percentage
- Compared gross profit % - Compared gross profit percentage
- Diff gr. prof. %-units – Difference gross profit percentage in units
- Quantity
- Compared quantity
- Average sales per customer inc. VAT – Average sales per customer including VAT
- Compared average sales per customer inc. VAT – Compared average sales per customer including VAT
Hidden parameters:
- pExcludedGroupsList – Report contain hidden parameter with selected article groups to be exluded by default. This parameter and pExcludedGroups will not work until parameter pExludeGroups will be set as True by user.
Source:
- Lindbak POS Reporting Cube (OLAP)
- Lindbak POS Reporting DW
- Department - Default all
- Article area - Default all
- Article group - Default all
- Number of items - Number of best or worst items to display - default 10
- Sort type - worst or best - report will display given number of worst or best selling items - default best
- Sort measure - amount/quantity/net cost/gross profit/gross profit % - set the measure on which the items are sorted. - default amount
- Vendor - default all
- Subvendor- default all
- Include VAT - Default on
- Exclude groups - Default false
- Excluded groups - Appears when Exclude groups is switched to true
Output: Sale statistics for selected number of best or worst items per store sorted by selected sort measure devided in two selected date intervals in selected hour range. Columns: - Store
- Dept. - Department
- Area
- Grp. - Item group
- EAN
- Item name
- Quantity
- Turnover ex. VAT
- Gross profit
- Gross profit %
- Num of receipts
Sorting: Clarifications: - Hour selection applies to each day in selected date period
- Negative values are colored red
Article group list is narrowed by selecting departments and article areas. By preventing problems with Excluded groups parameter, report will set all article groups in ExludedGroups (parameter is hidden and switched off until set true by user) if default groups in pExcludedGroupsList are not contain in previously selected department or article area. If user change department or article area and want set true on Exclude groups which not containg default groups to exclude, user have to manually choose new article groups to exclude, instead of all selected.
Hidden parameters: Source: - Lindbak POS Reporting cube (OLAP)
- Lindbak POS Reporting DW
|
| Anchor |
|---|
| 0756_CreditSalesWithPaymentsOnAccount |
|---|
| 0756_CreditSalesWithPaymentsOnAccount |
|---|
|
| Expand |
|---|
| title | 0756_CreditSalesWithPaymentsOnAccount |
|---|
|
CO: 208778. Based on report 0650 Image Added Description: Report shows credit sales and payments on account to get a better overview over drive-offs. Selections: - Date from - Default today
- Date to - Default today
- Team - Default all
- Retail store - Default all available in selected team
Output: One row per transaction grouped by store and customer. Page break and total for each store. Columns: - Date - date of the transaction,
- Receipt - receipt number of the transaction,
- Ref.no - reference number of the credit tender transaction,
- Ref.text - reference text of the credit tender transaction,
- Amount - amount inc. VAT of the credit tender transaction,
- Tax amount - VAT amount from articles,
- On account - payments when using payment on account function in POS.
Sorting: - Store number
- Customer key
- Transaction date
Clarifications: Transaction can be either Credit sale or Payment on account. If transaction is Payment on account there is no data available for columns: Ref.no and Ref.text Source:
|
| Anchor |
|---|
| 0757_MixSales |
|---|
| 0757_MixSales |
|---|
|
| Expand |
|---|
|
Image Added Description: Reports lists mix coupons for selected stores in selected period of time. Selections: - Date from - Default today
- Date to - Default today
- Profile - Default all
- Team - Default all
- Store - Default all
- Mix - Default all
Output: Report shows extended mixmatch sales statistics. For one page per store there is a list grouped by mix. Report has a total summaty at the end of table. Columns: - Mix - Mix number and mix name
- EAN
- Item name
- Department
- Item area
- Item group
- % of total sales - Percentage of total turnover excluding VAT
- Items sold - Number of items sold in mix
- % items sold - Percetnage of item sold in mix
- Discount ex. VAT - Mix discounts excluding VAT
- Receipts with mix
- Share mix receipts - Share of mix receipts
- Amount in mix receipts ex. VAT - Amount in mix receipts excluding VAT
- Avg. sales customer - Average sales customer
- Gr. prof. % mix - Gross profit percentage mix
- Gr. prof. % total - Gross profit percentage total
- Gross profit
Clarifications: Report has a star explanation for a few columns. It means that summary values for particular mix are calculated including all transactions in store. As an example '% Items sold' is calculating by taking quantity and dividing it by whole store quantity. For whole mix it will be store quantity of all items in store. For particular article in that mix '% Items sold', quantity of that product in mix will be divided by all articles in that mix. Summary for mix (grey grouped row) takes whole statistics about store, even if it is not mix. Source: - Lindbak POS Reporting Cube (OLAP)
|
| Anchor |
|---|
| 0758_SalesPerHour |
|---|
| 0758_SalesPerHour |
|---|
|
| Expand |
|---|
|
CO-271850 based on 0603_SalesPerHour
Image Added
Description: Report lists sales per hour with counting customer inside and outside. It also compares inside / outside data with selected period. Selections: - Periode – default month
- Year – Default current year
- Month – Default current month
- Week – Default current week
- Date from – Default today
- Date to – Default today
- Compare date from - Default yesterday.
- Compare date to - Default yesterday.
- Profile – Default all
- Team – Default all
- Store – Default all
- Exclude groups – Default false
- Excluded groups – Default list of excluded groups
Parameters: - pExcludedGroupsList - Parameter to create list of itemgroups to use in excluded groups selection (<name>;<itemgroupnumber>,<name>;<itemgroupnumber>). Default = Bilvask;93
- pPriceChannelIn - Parameter to define pricechannel for inside customers. Default = [Price Channel].[Price Channel Key].&[Cashier]
- pPriceChannelOut - Parameter to define pricechannel for outside customers. Default = [Price Channel].[Price Channel Key].&[ShopAndGoCheckTerminal]
- pHourFrom and pHourTo - Parameters to define which hours should be shown in report. Default 0 - 23.
Output: - Report has a summary at the end of table on each column.
- Summary totals in the beginning of new hierarchy level for store.
Columns: - Hour – Hour of a day
- Sales – Sales amount
- Net cost
- VAT – VAT amount
- Gr. prof. % - Gross profit percentage
- Share
- Items – Sales quantity
- Quantity - Customer inside/Customer outside quantity for period and comparison period
- Sale per customer - Customer inside/Customer outside sale per customer for period and comparison period
- Sales/item – Sales amount divided by item quantity Items per customer
- Items per customer
- Sales – Campaign sales amount
- Items – Campaign item quantity
- Customers – Campaign customer count
Source: - Lindbak POS Reporting DW
- Lindbak POS Reporting Cube (OLAP)
|
| Anchor |
|---|
| 0759_SalesAnalysisWithComparisonAndDrilldown |
|---|
| 0759_SalesAnalysisWithComparisonAndDrilldown |
|---|
|
| Expand |
|---|
| title | 0759_SalesAnalysisWithComparisonAndDrilldown |
|---|
|
CO-211507 / RTC-45144 Image Added
Description: Report shows sales statistics in a hierarchy from store to department, item area, item group and item. Report show statistics for all selected stores and a total page for all selected store.
Selections:
- Date from – Default today
- Date to – Default today
- Compare date from – Default last year from today
- Compare dat to – Default last year from today
- Hour from – Default 0:00
- Hour to – Default 24:00
- Team – Default all
- Stores – Default all
- Department – Default all
- Article area – Default all
- Article group – Default all
- Vendor – Default all
- Subvendor – Default all
- EAN list - Default empty
- Include VAT – Default false
- Exclude groups - Default false
- Excluded groups – Default groups 2 and 92. Appears when Exclude groups is switched to true
Output: One line per item with the hierarchy from store, department, item area and item group.
Columns: - EAN - Shows the entire hierchy down to EAN
- Item name - Item name
- Item num. - Item number
- Share - Percentage share of sales
- Sales - Sales amount
- Compared ex. VAT – Compared sales excluding VAT
- Diff % - Difference percentage between sales and compared sales
- Gross profit amt. – Gross profit amount Compared gross profit
- Gross profit % - Gross profit percentage
- Compared gross profit % - Compared gross profit percentage
- Diff gr. prof. %-units – Difference gross profit percentage in units
- Quantity
- Compared quantity
- Average sales per customer inc. VAT – Average sales per customer including VAT
- Compared average sales per customer inc. VAT – Compared average sales per customer including VAT
Hidden parameters: - pExcludedGroupsList – Report contain hidden parameter with selected article groups to be exluded by default. This parameter and pExcludedGroups will not work until parameter pExludeGroups will be set as True by user.
Source: - Lindbak POS Reporting Cube (OLAP)
- Lindbak POS Reporting DW
|
| Anchor |
|---|
| 0780_DailyReport |
|---|
| 0780_DailyReport |
|---|
|
| Expand |
|---|
|
Standard report  Image Added Image Added
 Image Added Image Added
Description: Report allows to follow up sales in a specified store: comparing fuel and non fuel articles on all product groups, selected tender measures, VAT and measures like: cash balance, card movements, card sales and shift statistics. Depending on number of results it can be multi page. Report is divided in 8 subreports which will be descriped separatly below. Selections (applies to all subreports): - Date from: Default yesterday
- Date to: Default yesterday
- Store: Single value; Default first available from the list.
Hidden parameters: - pFuelItemType - Item type number used to identify fuel items - Default: [Article].[Item Type].&[10]
- pPriceChannelOutdoor - Price channel number (in Reporting) used to identify outdoor sales - Default: [Price Channel].[Price Channel].&[11]
- pReasonCodeBreakage - Reason code name used to identify Driveoff - Default: [Reason Code].[Reason Code].&[Avstikk]&[Return]
Subreports:
| Expand |
|---|
| title | 1801_subItemGroupSales |
|---|
|  Image Added Image Added
Columns: - Item Group Name
- Item Group Number
- Quantity
- Amount
Rows: - One row per item group with divide to fuel and non fuel.
- Subtotal: Total for all rows above Subtotal
_____________ |
|
...
| Expand |
|---|
|
Standard report Image Removed Image Removed Description: Report allows to follow up sales in a specified store: comparing fuel and non fuel articles on all product groups, selected tender measures, VAT and measures like: cash balance, card movements, card sales and shift statistics. Depending on number of results it can be multi page. Report is divided in 8 subreports which will be descriped separatly below. Selections (applies to all subreports): - Date from: Default yesterday
- Date to: Default yesterday
- Store: Single value; Default first available from the list.
Hidden parameters: - pFuelItemType - Item type number used to identify fuel items - Default: [Article].[Item Type].&[10]
- pPriceChannelOutdoor - Price channel number (in Reporting) used to identify outdoor sales - Default: [Price Channel].[Price Channel].&[11]
- pReasonCodeBreakage - Reason code name used to identify Driveoff - Default: [Reason Code].[Reason Code].&[Avstikk]&[Return]
Subreports: | Expand |
|---|
| title | 1801_subItemGroupSales |
|---|
| Image Removed Columns: - Item Group Name
- Item Group Number
- Quantity
- Amount
Rows: - One row per item group with divide to fuel and non fuel.
- Subtotal: Total for all rows above Subtotal
______________________________________________________________________________________ |
| Expand |
|---|
|
| title | 1802_subProductSales |
|---|
|
 Image Removed
Columns:
- Item Group Name
- Item Group Number
- Quantity
- Amount
Rows:
- Subtotal Fuel
- Subtotal Non Fuel
______________________________________________________________________________________
| Expand |
|---|
|
 Image Removed Image Removed
Columns: - Tender Type
- Quantity = Tender Count
- Amount = Tender Amount
Rows: - Cash = TenderAmount for TenderType.Cash - This is sum of all cash sales from tender except controltransactions.
- Outdoor Card = TenderType.CreditDebit & TenderType.ECreditDebit selected price channel
- Indoor Card = All price channels except selected
- Credit = TenderType.Credit
- Other = All tender types except mentioned above
- Rounding
_____________________________________________________________________________________ - Total = Tender Amount - Rounding (can be negative)
|
| Expand |
|---|
|
 Image Removed Image Removed
Columns: - VAT
- Tax Amount
- Net Amount
- Amount
Rows: - One row per VAT with divide to fuel and non fuel.
- Subtotal: Total for all rows above Subtotal
______________________________________________________________________________________ |
| Expand |
|---|
| title | 1805_subCardMovement |
|---|
|
 Image Removed Image Removed
Columns: - Tender Type
- Quantity
- Amount
Rows: - Card
Cashback - Station Credit Payment
- In Payment
_____________________________________________________________________________________ |
| Expand |
|---|
|
 Image Removed Image Removed
Columns: - Tender Type
- Quantity
- Amount
Rows: - Cash = TenderAmount for TenderType.Cash - ControlAmount for TenderControlType.PayedIn + ControlAmount for TenderControlType.PayedOut
- Drop = ControlAmount for TenderControlType.Drop
- Paid In = ControlAmount for TenderControlType.PayedIn
- Paid Out = ControlAmount for TenderControlType.PayedOut
- Cashback = TenderAmount for TenderType.CashBack
- Station Credit Payment = TenderAmount for TenderControlType.Cash and TenderControlType.PaymentOnAccount
_____________________________________________________________________________________ - Total (Cash - Cashback - Drop + Paid In + Paid Out(negative) - Station Credit Payment)
= TenderAmount for TenderType.Cash - This is sum of all cash sales from tender except controltransactions.
- ControlAmount for TenderControlType.Drop - Sum of all cash sales from tender with controltransaction Drop
+ ControlAmount for TenderControlType.PayedIn - Sum of all cash sales from tender with controltransaction PayedIn
- ControlAmount for TenderControlType.PayedOut - Sum of all cash sales from tender with control transaction PayedOut
+ TenderAmount for TenderType.CashBack (negative value)
- Balance Amount Cash = BalanceAmount for TenderType.Cash
________________________________________________________________________________________ - TotalDifference (Balance Amount Cash - Total)
|
| Expand |
|---|
| title | 18071802_subCardSalessubProductSales |
|---|
|
 Image RemovedImage Added Image RemovedImage Added
Columns: - Item Group Name
- Item Group Number
- Card Number
- Card Name
- Quantity Outdoor
- Amount Outdoor
- Quantity Indoor
- Amount Indoor
- Quantity
- Amount
Rows: - Subtotal Fuel
- Subtotal Non FuelOne row per Card
______________________________________________________________________________________
|
| Expand |
|---|
| title | 18081803_subShiftStatisticssubTenderSales |
|---|
|
 Image RemovedImage Added Image RemovedImage Added
Columns: - Tender Type Grouping
- Quantity = Tender Type
- Quantity
- Count
- Amount = Tender Amount
Rows: - Cash = TenderAmount for TenderType.Cash - This is sum of all cash sales from tender except controltransactions.
- Outdoor Card = TenderType.CreditDebit & TenderType.ECreditDebit selected price channel
- Indoor Card = All price channels except selected
- Credit = TenderType.Credit
- Other = All tender types except mentioned above
- RoundingReturn Transaction
- Fuel
Non Fuel
_____________________________________________________________________________________ - Total = Tender Amount - Rounding (can be negative)
|
| Expand |
|---|
|
Image Added Columns: - VAT
- Tax Amount
- Net Amount
- Amount
Rows: - One row per VAT with divide to fuel and non fuel.
- Subtotal: Total for all rows above Subtotal
_ ______________________________________________________________________________________ |
| Expand |
|---|
| title | 1805_subCardMovement |
|---|
|
Image Added Columns: - Tender Type
- Quantity
- Amount
Rows: - Card
Cashback - Station Credit Payment
- In Payment
_____________________________________________________________________________________ |
| Expand |
|---|
|
Image Added Columns: - Tender Type
- Quantity
- Amount
Rows: - Cash = TenderAmount for TenderType.Cash - ControlAmount for TenderControlType.PayedIn + ControlAmount for TenderControlType.PayedOut
- Drop = ControlAmount for TenderControlType.Drop
- Paid In = ControlAmount for TenderControlType.PayedIn
- Paid Out = ControlAmount for TenderControlType.PayedOut
- Cashback = TenderAmount for TenderType.CashBack
- Station Credit Payment = TenderAmount for TenderControlType.Cash and TenderControlType.PaymentOnAccount
________________________________________________________________________________________________________________________ - Total (Cash - Cashback - Drop + Paid In + Paid Out(negative) - Station Credit Payment)
= TenderAmount for TenderType.Cash - This is sum of all cash sales from tender except controltransactions.
- ControlAmount for TenderControlType.Drop - Sum of all cash sales from tender with controltransaction Drop
+ ControlAmount for TenderControlType.PayedIn - Sum of all cash sales from tender with controltransaction PayedIn
- ControlAmount for TenderControlType.PayedOut - Sum of all cash sales from tender with control transaction PayedOut
+ TenderAmount for TenderType.CashBack (negative value)
- Balance Amount Cash = BalanceAmount for TenderType.CashFillings
- Post Pay
Outdoor Card
_____________________________________________________________________________________ - Difference (Balance Amount Cash - Total)
|
| Expand |
|---|
|
Image Added Columns: - Card Number
- Card Name
- Quantity Outdoor
- Amount Outdoor
- Quantity Indoor
- Amount Indoor
- Quantity
- Amount
Rows: _____________________________________________________________________________________ - Miscellaneous
- Cancelled Receipts
- Drive Off
- Pos Shift Count
|
Source:
- Lindbak POS Reporting cube (OLAP)
...
| title | 0781_CashierStatisticsWithDiscount |
|---|
______________________________________________ |
| Expand |
|---|
| title | 1808_subShiftStatistics |
|---|
| Image Added Columns: - Tender Type Grouping
- Tender Type
- Quantity
- Amount
Rows: _____________________________________________________________________________________ _____________________________________________________________________________________ _____________________________________________________________________________________ _____________________________________________________________________________________ _____________________________________________________________________________________ _____________________________________________________________________________________ - Miscellaneous
- Cancelled Receipts
- Drive Off
- Pos Shift Count
|
Source: - Lindbak POS Reporting cube (OLAP)
|
| Anchor |
|---|
| 0781_CashierStatisticsWithDiscount |
|---|
| 0781_CashierStatisticsWithDiscount |
|---|
|
| Expand |
|---|
| title | 0781_CashierStatisticsWithDiscount |
|---|
|
[RTC-44550] [YXB] New cashier statistics report (0781) with Fuel column (CO-344179)  Image Added Image Added
Description: - Report allows to follow up Cashiers sales and selected activities (based on: 0019)
Selections: - Date from: Default today
- Date to: Default today
- Retail store: Default all
- Operator: Default all
- Include VAT: Allows to decide if Vat is included in sales amount or not; default yes.
Hidden parameters: - pFuelItemType - Item type number used to identify fuel items - Default: [Article].[Item Type].&[10]
- pDiscountKeys - Discount keys to include in discount statistics - Default: [Discount].[Discount Key].[ALL]
- pExcludeStores - Store numbers to be excluded from the report - Default: 9997,9998,99900,99901
Output: One page per store - one row per cashier Columns: - No: Operator number
- Name: Operator name
- Turnover inc VAT/ Turnover ex VAT - total turnover, except for fuel items (items of type fuel - defined in hidden parameter pFuelItemType)
- Fuel inc VAT/Fuel ex. VAT - total turnover for fuel items (items of type fuel - defined in hidden parameter pFuelItemType)
- Receipts: number of reciepts
- Returns
- Deleted receipts
- Deleted item lines
- Receipts on hold
- Deleted on hold
- Null: Number of drawer opening without any transaction
- Ovr. prc.: Overriden price count
- Manual Discount Amount
- Manual Discoun percent.: Discount Amount divided by Original amount
- Scan: Number of scanned articles
- Discount: Discount quantity
- Scan %: Scan divided by Quantity of sold items
Sorting: Source: - Lindbak POS Reporting cube (OLAP)
|
| Anchor |
|---|
| 0783_DailyReportVat |
|---|
| 0783_DailyReportVat |
|---|
|
| Expand |
|---|
|
Standard report 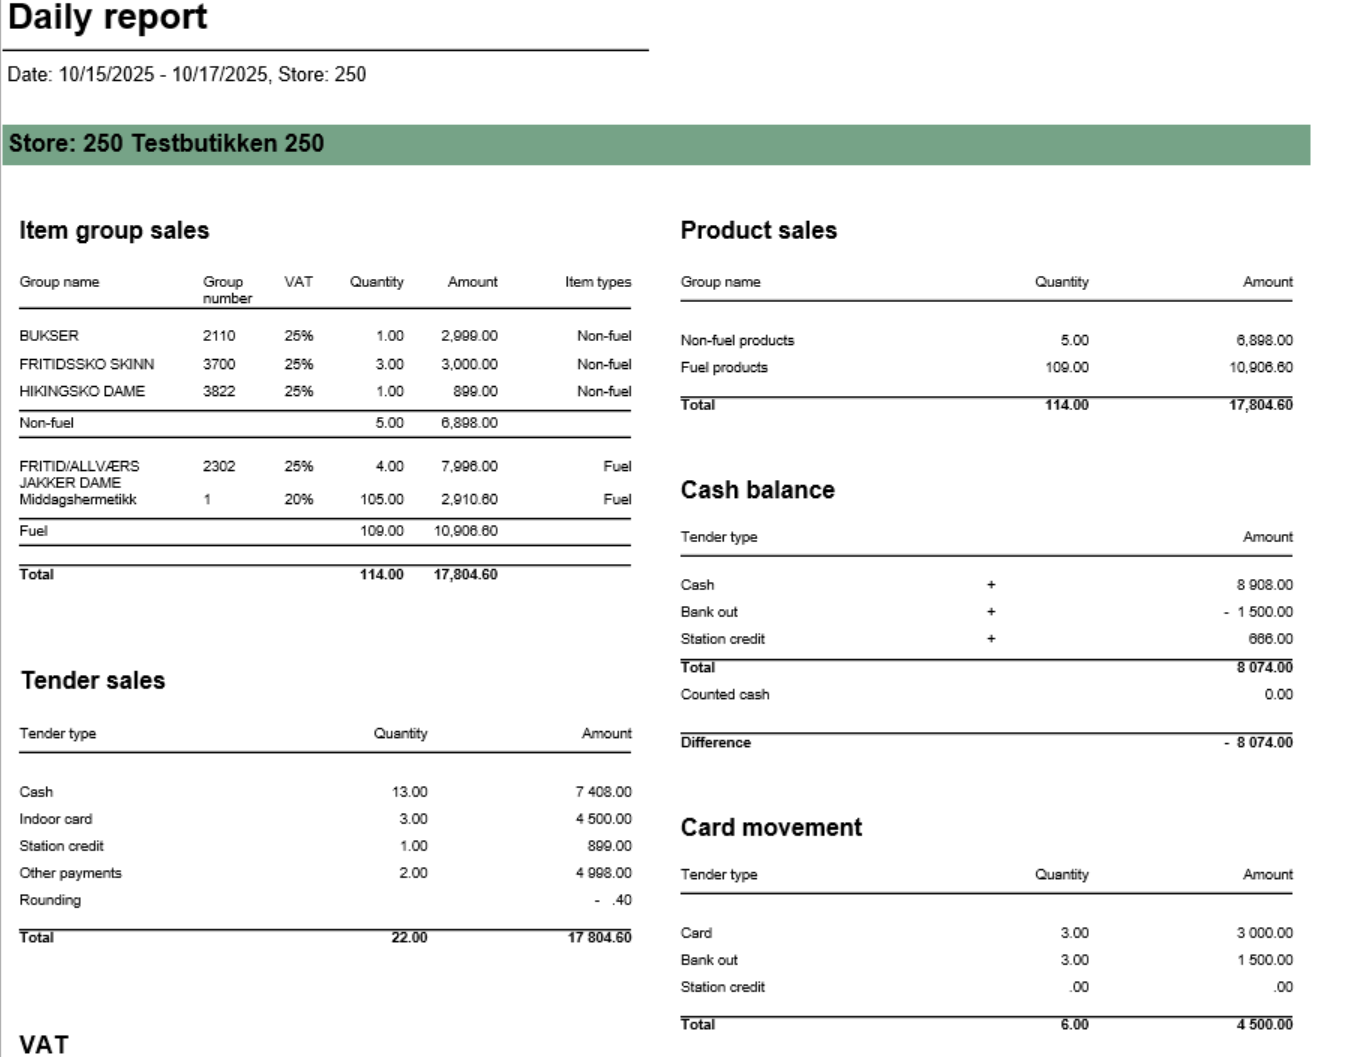 Image Added Image Added
 Image Added Image Added
Description: Report provides comprehensive daily settlement and sales statistics per store. Similar to 0780_DailyReport but with enhanced VAT breakdown. Report is divided into multiple sections showing product sales, tender types, cash reconciliation, card payments, and drive-off tracking. Selections (applies to all sub reports): - Date from: Default yesterday
- Date to: Default yesterday
- Retail store: Single value; default first available from the list
Hidden parameters: - pFuelItemType: Default \[Article\].\[Item Type\].&\[Fuel\] - Defines which item types qualify as fuel
- pOtherPaymentCards: Default 30,31,32,33,34,35,36,37,38,39 - Payment card numbers for "other payments" section
- pReasonCodeBreakage: Default \[Reason Code\].\[Reason Code\].&\[Avstikk\]&\[Return\] - Reason code for drive-off tracking
- pPriceChannelOutdoor: Default \[Price Channel\].\[Price Channel\].&\[11\] - Price channel qualifying as outdoor sales
Source: - Lindbak POS Reporting Cube (OLAP) - All reports
- Lindbak POS Reporting DW - 1812, Item Group Driveoff section only
| Expand |
|---|
| title | 1802_subProductSales |
|---|
| Image Added Columns: - Item Group Name
- Item Group Number
- Quantity
- Amount
Rows: - Subtotal Fuel
- Subtotal Non Fuel
______________________________________________________________________________________
|
| Expand |
|---|
| Image Added Columns: - VAT
- Tax Amount
- Net Amount
- Amount
Rows: - One row per VAT with divide to fuel and non fuel.
- Subtotal: Total for all rows above Subtotal
______________________________________________________________________________________ |
| Expand |
|---|
| title | 1805_subCardMovement |
|---|
| Image Added Columns: - Tender Type
- Quantity
- Amount
Rows: - Card
Cashback - Station Credit Payment
- In Payment
_____________________________________________________________________________________ |
| Expand |
|---|
| Image Added Columns: - Tender Type
- Quantity
- Amount
Rows: - Cash = TenderAmount for TenderType.Cash - ControlAmount for TenderControlType.PayedIn + ControlAmount for TenderControlType.PayedOut
- Drop = ControlAmount for TenderControlType.Drop
- Paid In = ControlAmount for TenderControlType.PayedIn
- Paid Out = ControlAmount for TenderControlType.PayedOut
- Cashback = TenderAmount for TenderType.CashBack
- Station Credit Payment = TenderAmount for TenderControlType.Cash and TenderControlType.PaymentOnAccount
_____________________________________________________________________________________ - Total (Cash - Cashback - Drop + Paid In + Paid Out(negative) - Station Credit Payment)
= TenderAmount for TenderType.Cash - This is sum of all cash sales from tender except controltransactions.
- ControlAmount for TenderControlType.Drop - Sum of all cash sales from tender with controltransaction Drop
+ ControlAmount for TenderControlType.PayedIn - Sum of all cash sales from tender with controltransaction PayedIn
- ControlAmount for TenderControlType.PayedOut - Sum of all cash sales from tender with control transaction PayedOut
+ TenderAmount for TenderType.CashBack (negative value)
- Balance Amount Cash = BalanceAmount for TenderType.Cash
_____________________________________________________________________________________ - Difference (Balance Amount Cash - Total)
|
| Expand |
|---|
| Image Added Columns: - Card Number
- Card Name
- Quantity Outdoor
- Amount Outdoor
- Quantity Indoor
- Amount Indoor
- Quantity
- Amount
Rows: ______________________________________________________________________________________ |
| Expand |
|---|
| title | 1809_subItemGroupSalesVat |
|---|
| 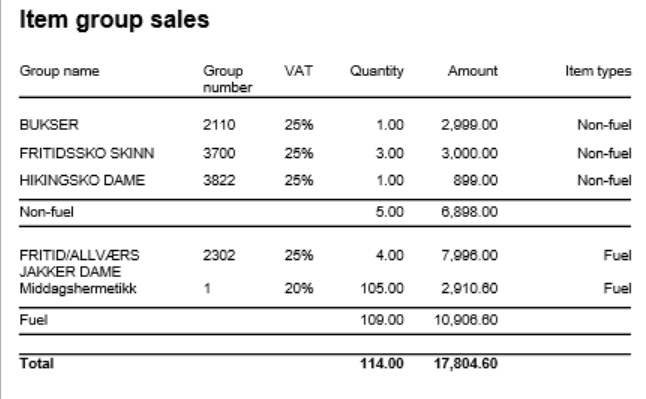 Image Added Image Added
Columns: - Item Group Name
- Item Group Number
- VAT: VAT percentage
- Quantity: Sold quantity
- Amount: Sales amount inc. VAT
- Type: Fuel or Non-Fuel classification
Grouping: - Data grouped by Fuel vs Non-Fuel products
- Subtotals per fuel type
- Grand total for all item groups
|
| Expand |
|---|
| title | 1811_subTenderSales_2 |
|---|
| 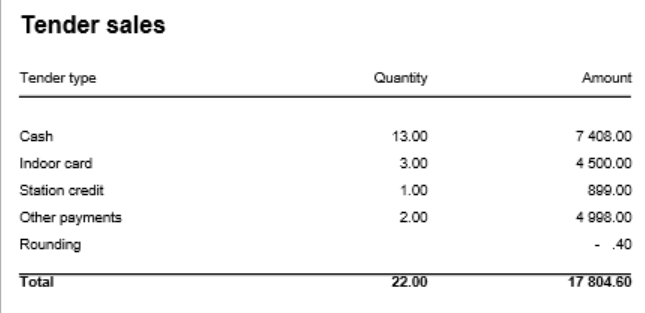 Image Added Image Added
Columns: - Tender Type
- Quantity: Number of transactions
- Amount: Tender amount
Rows: - Cash: Cash payments (excluding control transactions)
- Outdoor Card: Card payments via outdoor price channel
- Indoor Card: Card payments via indoor price channels
- Station Credit: Station credit payments
- Other: Other tender types
- Rounding: Subtotal rounding amount
- Total: Sum of all tender types
|
| Expand |
|---|
| title | 1810_subTenderSalesOtherPayments |
|---|
| 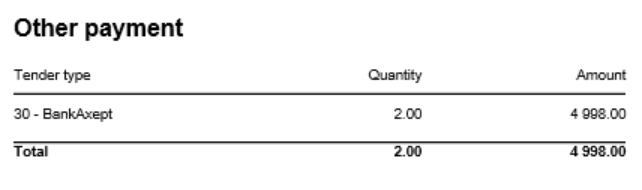 Image Added Image Added
Columns: - Tender Type: Payment card number and name
- Quantity: Number of transactions
- Amount: Tender amount
Rows: - One row per payment card included in pOtherPaymentCards parameter (default: cards 30-39)
- Total row
- Rows with zero amount are hidden
|
| Expand |
|---|
| title | 1812_subItemGroupDriveoff |
|---|
| 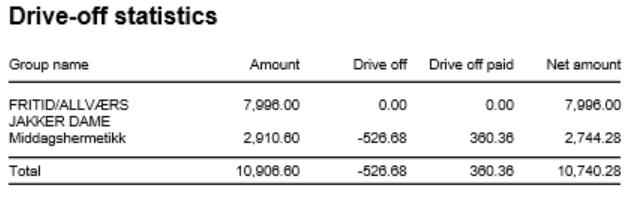 Image Added Image Added
Columns: - Item Group Name: Article group name
- Amount: Total sales amount inc. VAT
- Drive Off: Breakage amount (negative transactions)
- Drive Off Paid: Sold/paid amount (positive transactions)
- Net Amount: Grand total (Amount + Drive Off + Drive Off Paid)
Rows: - One row per article group
- Total row
- Entire section hidden if both totals are zero
Clarifications: - Uses reason code from pReasonCodeBreakage parameter to identify drive-off transactions
- Drive Off column shows negative values from item transactions
- Drive Off Paid shows positive values from item transactions
- Only includes fuel item types specified in pFuelItemType parameter
Sorting: - No interactive sorting
- Data sorted by natural hierarchy (Store, Article Group, etc.)
|
|
| Anchor |
|---|
| 0790_CashierStatistics |
|---|
| 0790_CashierStatistics |
|---|
|
| Expand |
|---|
| title | 0790_CashierStatistics |
|---|
|
[RTC-39849] TRN: Cashier security statistics report with turnover split and price checks - EG A/S  Image Added Image Added
Description: - Report allows to follow up Cashiers sales and selected activities.
Selections: - Date from: Default today
- Date to: Default today
- Retail store: Default all
- Operator: Default all
Output: One page per store One row per cashier Columns: - No: Operator number
- Name: Operator name
- Tender (NB! this is tender data and does not represent turnover).
- Cash
- Other (ohter than cash)
- Receipts: number of reciepts
- Returns
- Deleted receipts
- Deleted item lines
- Receipts on hold
- Null: Number of drawer opening without any transaction
- Ovr. prc.: Overriden price count
- Scan %: Scan divided by Quantity of sold items
- Discount: Discount quantity
- Price check: How many times price check funtion is used.
Sorting: Source: - Lindbak POS Reporting cube (OLAP)
|
| Anchor |
|---|
| 0791_ShiftBalanceReport |
|---|
| 0791_ShiftBalanceReport |
|---|
|
| Expand |
|---|
| title | 0791_ShiftBalanceReport |
|---|
|
[RTC-44692] [TRN] Shift balance report (CO-335148)  Image Added Image Added
Description: - The report gives an overview of all shifts in the selected date range and for selected store(s) and workstations.
Selections: - Date from: default today
- Date to: default today
- Retail store: default all
- Workstation: default all
- Main currency (hidden): default NOK - the main currency for cash calculations.
Parameters: - pShiftEndDate - Determine if shift date should be based on start- or end-date for the shift. Default False meaning it is based on start-date. Chosed date-type is used both in report (Shift date column) and in date selection.
Output: The report consist of four tables: - Shift overview - lists all shifts in the selected date range and for given store(s) and cash registers and contains the details about each shift balance (if registered).
- Currency - lists all currencies (except the main currency), their exchange rates and amount in main currency
- VAT overview - lists all VAT rates with sales gross, net and tax amount
- Payment card overview - lists all payment cards and related statistics (number of transactions and amount)
Columns: - Shift overview
- Store - store number,
- ShiftID - ID of the shift,
- Shift date - shift start date, or end date, depending on parameter pShiftEndDate
- Balance receipt ID - ID of the balance receipt for given shift,
- Cashier No - cashier number,
- All tenders - total tender amount for given shift,
- Card - total amount paid by cards for given shift (tender types: CreditDebit, ECreditDebit, CreditDebitOffline),
- Cash - total amount paid by cash in main currency for given shift,
- Other - other tender types, aggregated, for given shift
- Currency - total amount paid by cash in foreign currencies (all except main currency) for given shift,
- Counted cash - balance amount of cash tender type in main currency for given shift,
- Counted currency - balance amount of cash tender type in foreign currencies for given shift,
- Difference: (Counted cash - Cash) + (Counted currency - Currency)
- Bag number - bag number registered on the balance receipt
- Currency
- Code - currency code (3 letter code),
- Exchange rate - the average exchange rate for selected period,
- Currency amount - amount in currency,
- Amount in XXX - amount in main currency (default NOK)
- VAT overview
- VAT rate,
- Sales inc. VAT,
- VAT amount,
- Sales excl. VAT,
- Nonsale
- Payment card overview:
- Card - card issuer ID and name,
- Quantity - number of transactions,
- Amount - total amount of transactions
Sorting: - Shift overview - sorted by store number and shift date (ascending),
- Currency - sorted by currency code (A to Z),
- VAT overview - sorted by VAT rate (ascending),
- Payment card overview - sorted by card issuer ID (ascending)
Source: - Lindbak POS Reporting cube (OLAP)
- Lindbak POS Reporting DW
|
| Anchor |
|---|
| 0800_TopXArticlesSold |
|---|
| 0800_TopXArticlesSold |
|---|
|
| Expand |
|---|
| title | 0800_TopXArticlesSold |
|---|
|
 Image Added Image Added
Description: Report lists top items sold in selected stores in period time. Selections: - Region – Default all
- Store – Default all
- Date from – Default today
- Date to – Default today
- Department – Default all
- Article Group – Default all
- Article Subgroup – Default all
- Vendor – Default all
- Top X – Number of rows, default set 10
Output: Report shows top x items and item groups with their amount, gross profit and quantity in selected ranges. Report sum up all columns with numbers. Columns: - Item num. – Item number
- Item name – Article long name
- Item group – Group number and article group
- Vendor
- name Ex. VAT – Net amount
- Gross profit
- Gross profit % - Gross profit percentage
- Quantity
- Average price inc VAT – Average price including VAT
- Discount ex. VAT - Item discount excluding VAT
Clarifications: If vendor name is not avaible return empty rows. Source: - Lindbak POS Reporting Cube (OLAP)
|
| Anchor |
|---|
| 0801_CustomerFrequency |
|---|
| 0801_CustomerFrequency |
|---|
|
| Expand |
|---|
| title | 0801_CustomerFrequency |
|---|
|
 Image Added Image Added
Description: Report lists how often customer buys product in comparison to previous period time. Selections: - Date from – Default first day of a current week
- Date to – Default today
- Compare date from - Default year ago from today
- Compate date to - Default year ago from today
- Region – Default all
- Store – Default all
Output: Report shows amount, number of customers and sold items for selected stores, regions and period time in comparison to previous selected period time. Raport presents percentage differences and sum up all columns for selected stores Columns: - Store – Store name
- Region- Team name
- Share – percentage net amount
- Ex. VAT – net amount
- Compared sales ex. VAT – Compared net amount
- Diff % - Percentage difference to compared date
- Customers num – Customer number
- Compared number of customers
- Diff % - Percentage difference to compared date
- Items per customer
- Compared items per customer
- Diff % - Percentage difference to compared date
- Avg. sales customer – Average sales customer
- Compared average sales per customer
- Diff % - Percentage difference to compared date
Clarifications: Diff % is percentage difference (increase or decrease) between date and comparable date Source: - Lindbak POS Reporting Cube (OLAP)
|
| Anchor |
|---|
| 0802_SalesPerArticleGroup |
|---|
| 0802_SalesPerArticleGroup |
|---|
|
| Expand |
|---|
| title | 0802_SalesPerArticleGroup |
|---|
|
 Image Added Image Added
Description: Report lists sales per department and comparison sales in selected period of time. Selections: - Region – Default all
- Store – Default all
- Date from – Default today
- Date to – default today
- Compare date from - Default the same day of week as Date from year before
- Compare date to - Default the same day of week as Date to but year before
- Department – Default all
- Article group – Default all
- Article subgroup – Default all
- Vendor – Default all
Output: - Report has a summary for each column for all selected departments.
- Summary totals in the beginning of new hierarchy level for:
- Department
- Article group
- Article subgroup
Columns: - Buttons for expanding and collapsing all drilldowns
- Department – Department number and name
- Share Ex. VAT – Sales Excluding VAT
- Compared sales ex. VAT – Compared sales excluding VAT
- Diff % - Difference percentage between sales excluding VAT
- Gross profit amt. – Gross profit amount
- Compared gross profit
- Gross profit % - Gross profit percentage
- Compared gross profit % - Compared gross profit percentage
- Diff. gr. prof. %-units – Difference gross profit percentage in units
- Quantity
- Compared quantity
- Average sales per customer inc VAT – Average sales per customer including VAT
- Discount ex. VAT – Discount excluding VAT
- Activity result – Activity result between discount exc. VAT and exc. VAT
Source: - Lindbak POS Reporting Cube (OLAP)
|
| Anchor |
|---|
| 0803_SalesPerAssortment |
|---|
| 0803_SalesPerAssortment |
|---|
|
| Expand |
|---|
| title | 0803_SalesPerAssortment |
|---|
|
 Image Added Image Added
Description: Report lists sales per assortment and comparison sales in selected period of time. Selections: - Region – Default all
- Store – Default all
- Date from – Default today
- Date to – default today
- Compare date from - Default the same day of week as Date from year before
- Compare date to - Default the same day of week as Date to but year before
- Department – Default all
- Article group – Default all
- Article subgroup – Default all
- Vendor – Default all
- Item number – Default empty
Output: - Report has a summary for each column for all selected stores.
- Summary totals in the beginning of new hierarchy level for stores.
Columns: - Buttons for expanding and collapsing all drilldowns
- Store – Store name
- Region – Region team Share Ex. VAT – Sales Excluding VAT
- Compared ex. VAT – Compared sales excluding VAT
- Diff % - Difference percentage between sales and compared sales
- Gross profit amt. – Gross profit amount Compared gross profit
- Gross profit % - Gross profit percentage
- Compared gross profit % - Compared gross profit percentage
- Diff gr. prof. %-units – Difference gross profit percentage in units
- Quantity
- Compared quantity
- Average sales per customer inc. VAT – Average sales per customer including VAT
- Compared average sales per customer inc. VAT – Compared average sales per customer including VAT
Source: - Lindbak POS Reporting Cube (OLAP)
|
| Anchor |
|---|
| 0804_DashBoard |
|---|
| 0804_DashBoard |
|---|
|
| Expand |
|---|
|
 Image Added Image Added
Description: Report lists dashboard comparison sales, gross profit and customers with compare date for one day and the whole week. Selections: - Date – Default today
- Compare date – Default last week from today
- Team – Default all
- Store – Defaul all
Output: - Report shows sales, gross profit and customers statistics for selected date and selected compared date. Appropriately report shows statistics for whole week for that selected day.
- Report has six Gauge panels which compared statistics from current hour in percentage.
Columns: - Sales – Whole day sales
- Sales until 12 – Date sales to current hour
- Compared sales until 12 – Compared date sales to current hour
- Gross profit – Whole day gross profit
- Gross profit until 12 – Date gross profit to current hour
- Compared gross profit until 12 – Compared date gross profit to current hour
- Customers – Whole day customer count
- Customers until 12 – Date customer count to current hour
- Compared customers until 12 – Compared customer count to current hour
Source: - Lindbak POS Reporting Cube (OLAP)
|
| Anchor |
|---|
| 0805_ReconciliationOfGiftcards |
|---|
| 0805_ReconciliationOfGiftcards |
|---|
|
| Expand |
|---|
| title | 0805_ReconciliationOfGiftcards |
|---|
|
 Image Added Image Added
Description: Report lists reconciliation of giftcards. Selections: - Type – Default gift card
- GiftCard type- Default all
- Store – Default all
- Date from – Default today
- Date to – Default today
Output: Report shows reconciliation of giftcards with statistics for selected stores. Columns: - Store – Store number
- Issued – Sum amount issue
- Redeemed – Sum amount redeemed
- Accumulater expired balance
- Corrections – Corrections amount
Interactive sorting: Interactive sorting on all columns Source:
|
| Anchor |
|---|
| 0806_GiftcardsBalancePerStore |
|---|
| 0806_GiftcardsBalancePerStore |
|---|
|
| Expand |
|---|
| title | 0806_GiftcardsBalancePerStore |
|---|
|
 Image Added Image Added
Description: Report lists giftcard balance per store. Selections: - Store – Default all
- Type – Default gift card
- GiftCard type – Default all
Output: Report has a summary at the end of table. Columns: - Store – Store number
- Balance - ScripBalance
Source:
|
| Anchor |
|---|
| 0807_GiftcardReconciliationPerStore |
|---|
| 0807_GiftcardReconciliationPerStore |
|---|
|
| Expand |
|---|
| title | 0807_GiftcardReconciliationPerStore |
|---|
|
 Image Added Image Added
Description: Report lists reconciliation of giftcards per store. Selections: - Date from – Default today
- Date to – Default today
- Type – Default gift card
- Store – Default all
Output: Report has table for each store and summary at the end of each column on that table. Columns: - Giftcard number
- Issued amount
- Redeemed amount
- Balance correction amount
- Issued date
- Redeemed date
Interactive sorting: Interactive sorting on all columns. Source:
|
| Anchor |
|---|
| 0808_MemberAndElectronicCommunication |
|---|
| 0808_MemberAndElectronicCommunication |
|---|
|
| Expand |
|---|
| title | 0808_MemberAndElectronicCommunication |
|---|
|
CO-99244, PBI#155899  Image Added Image Added
Description: Report lists members and e-mail/SMS subscriptions Selections: - Loyalty program – Default Loyalty program
- Store – Default all
Output: Report shows members with e-mail/SMS subscriptions, one row per store with summary of each column. Columns: - Store – Store number and store name
- Members – Members quantity
- Email – Email quantity
- Mobile – Mobile quantity
Source:
|
| Anchor |
|---|
| 0809_LoyaltyStatistics |
|---|
| 0809_LoyaltyStatistics |
|---|
|
| Expand |
|---|
| title | 0809_LoyaltyStatistics |
|---|
|
CO-99233, PBI#155902. Based on report 0519  Image Added Image Added
Description: Report lists loyalty statistics. Selections: - Loyalty program – Default loyalty program
- Date from – Default today
- Date to – Default today
- Store – Default all
Output: Report is divided on 4 tables and 2 charts. Every table has a stotal sumamry at the end table for each column. Columns: - New members in period table
- Sex – Female, male and unknown
- This year – Number of new members
- Last year – Number of new members last year
- New member in period circle chart
- This year – New member this year
- Last year – New member last year
- Sales statistics table
- Member and not member rows
- Num of receipts – Number of receipts
- Tot. sales amt. – Total sales amount
- Avg amount – Average amount
- Items – Items quantity
- Items/cust – Number of items over number of sales for members.
- Gross profit
- Gr. prof. % - Gross profit percentage
- Sales by gender/age groups table
- Age group
- Male/Female
- Sales – Sales amount
- Gross profit
- Gr. prof. % - Gross profit percentage
- Sales by gender/age groups chart
- X – axis – Age group
- Y – axis – Sales amount
- Legend – Male and Female bars
- Sales by gender/department table
- Department
- Sales amount
- Male – Male sales amount
- Female – Female sales amount
- Unknown – Unknown sales amount
- Total – Total amount for all genders
- Total %
- Male – Male sales amount percentage
- Female – Female sales amount percentage
- Unknown – Unknown sales amount percentage
- Total – Total sales amount for all genders percentage
Source: - Lindbak POS Reporting Cube
|
[RTC-44550] [YXB] New cashier statistics report (0781) with Fuel column (CO-344179)
Image Removed
Description:
- Report allows to follow up Cashiers sales and selected activities (based on: 0019)
Selections:
- Date from: Default today
- Date to: Default today
- Retail store: Default all
- Operator: Default all
- Include VAT: Allows to decide if Vat is included in sales amount or not; default yes.
Hidden parameters:
- pFuelItemType - Item type number used to identify fuel items - Default: [Article].[Item Type].&[10]
- pDiscountKeys - Discount keys to include in discount statistics - Default: [Discount].[Discount Key].[ALL]
- pExcludeStores - Store numbers to be excluded from the report - Default: 9997,9998,99900,99901
Output:
One page per store - one row per cashier
Columns:
- No: Operator number
- Name: Operator name
- Turnover inc VAT/ Turnover ex VAT - total turnover, except for fuel items (items of type fuel - defined in hidden parameter pFuelItemType)
- Fuel inc VAT/Fuel ex. VAT - total turnover for fuel items (items of type fuel - defined in hidden parameter pFuelItemType)
- Receipts: number of reciepts
- Returns
- Deleted receipts
- Deleted item lines
- Receipts on hold
- Deleted on hold
- Null: Number of drawer opening without any transaction
- Ovr. prc.: Overriden price count
- Manual Discount Amount
- Manual Discoun percent.: Discount Amount divided by Original amount
- Scan: Number of scanned articles
- Discount: Discount quantity
- Scan %: Scan divided by Quantity of sold items
Sorting:
Source:
- Lindbak POS Reporting cube (OLAP)
...
| title | 0790_CashierStatistics |
|---|
[RTC-39849] TRN: Cashier security statistics report with turnover split and price checks - EG A/S
Image Removed
Description:
- Report allows to follow up Cashiers sales and selected activities.
Selections:
- Date from: Default today
- Date to: Default today
- Retail store: Default all
- Operator: Default all
Output:
One page per store
One row per cashier
Columns:
- No: Operator number
- Name: Operator name
- Tender (NB! this is tender data and does not represent turnover).
- Cash
- Other (ohter than cash)
- Receipts: number of reciepts
- Returns
- Deleted receipts
- Deleted item lines
- Receipts on hold
- Null: Number of drawer opening without any transaction
- Ovr. prc.: Overriden price count
- Scan %: Scan divided by Quantity of sold items
- Discount: Discount quantity
- Price check: How many times price check funtion is used.
Sorting:
Source:
- Lindbak POS Reporting cube (OLAP)
...
| Expand |
|---|
| title | 0791_ShiftBalanceReport |
|---|
|
[RTC-44692] [TRN] Shift balance report (CO-335148) Image Removed Description: - The report gives an overview of all shifts in the selected date range and for selected store(s) and workstations.
Selections: - Date from: default today
- Date to: default today
- Retail store: default all
- Workstation: default all
- Main currency (hidden): default NOK - the main currency for cash calculations.
Parameters: - pShiftEndDate - Determine if shift date should be based on start- or end-date for the shift. Default False meaning it is based on start-date. Chosed date-type is used both in report (Shift date column) and in date selection.
Output: The report consist of four tables: - Shift overview - lists all shifts in the selected date range and for given store(s) and cash registers and contains the details about each shift balance (if registered).
- Currency - lists all currencies (except the main currency), their exchange rates and amount in main currency
- VAT overview - lists all VAT rates with sales gross, net and tax amount
- Payment card overview - lists all payment cards and related statistics (number of transactions and amount)
Columns: - Shift overview
- Store - store number,
- ShiftID - ID of the shift,
- Shift date - shift start date, or end date, depending on parameter pShiftEndDate
- Balance receipt ID - ID of the balance receipt for given shift,
- Cashier No - cashier number,
- All tenders - total tender amount for given shift,
- Card - total amount paid by cards for given shift (tender types: CreditDebit, ECreditDebit, CreditDebitOffline),
- Cash - total amount paid by cash in main currency for given shift,
- Other - other tender types, aggregated, for given shift
- Currency - total amount paid by cash in foreign currencies (all except main currency) for given shift,
- Counted cash - balance amount of cash tender type in main currency for given shift,
- Counted currency - balance amount of cash tender type in foreign currencies for given shift,
- Difference: (Counted cash - Cash) + (Counted currency - Currency)
- Bag number - bag number registered on the balance receipt
- Currency
- Code - currency code (3 letter code),
- Exchange rate - the average exchange rate for selected period,
- Currency amount - amount in currency,
- Amount in XXX - amount in main currency (default NOK)
- VAT overview
- VAT rate,
- Sales inc. VAT,
- VAT amount,
- Sales excl. VAT,
- Nonsale
- Payment card overview:
- Card - card issuer ID and name,
- Quantity - number of transactions,
- Amount - total amount of transactions
Sorting: - Shift overview - sorted by store number and shift date (ascending),
- Currency - sorted by currency code (A to Z),
- VAT overview - sorted by VAT rate (ascending),
- Payment card overview - sorted by card issuer ID (ascending)
Source: - Lindbak POS Reporting cube (OLAP)
- Lindbak POS Reporting DW
|
| Anchor |
|---|
| 08000810_TopXArticlesSoldLoyaltyClubSales0800 |
|---|
| 0810_TopXArticlesSoldLoyaltyClubSales |
|---|
|
| Expand |
|---|
| title | 0800_TopXArticlesSold | 0810_LoyaltyClubSales |
|---|
|
CO-92729, PBI#155905
 Image AddedImage Removed Image AddedImage Removed
Description: Report lists top items sold in selected stores in period timesales in selected stores in loyalty clubs. Report also present turnover chart. Selections: - Region Loyalty program – Default allStore – Default allfirst loyalty program
- Date from – Default today
- Date to – Default today
- Department Team – Default all
- Article Group Store – Default allArticle
- Subgroup Department – Default all
- Vendor – Default all
- Top X – Number of rows, default set 10
Output: top x items and item groups with their amount, gross profit and quantity in selected ranges. Report sum up all columns with numbers- sales statistics in loyalty club for selected stores. Report has a summary at the end of each column.
- Report has a turnover bar chart. On x-axis are turnover information bars: total, not member, member and employees. On y-axis is turnover amount.
Columns: - Item num. No – Item Store number
- Item name – Article long name
- Item group – Group number and article group
- Vendor
- name Ex. VAT – Net amount
- Gross profit
- Gross profit % - Gross profit percentage
- Quantity
- Average price inc VAT – Average price including VAT
- Discount ex. VAT - Item discount excluding VAT
Clarifications: If vendor name is not avaible return empty rows.- Store – Store name
- Turnover
- Total – Total turnover amount
- Not member – Turnover amount without members
- Member - Turnover amount with members
- Employees – Turnover employees amount
- % of total sales
- Not member – Percentage of total sales without members
- Member - Percentage of total sales with members
- Gross profit %
- Total – Total gross profit percentage
- Not member – Total gross profit percentage without members
- Member - Total gross profit percentage with members
- Employees – Total gross profit percentage
- Average quantity sold
- Average sale in sum
Source: - Lindbak POS Reporting Cube (OLAP)
|
| Anchor |
|---|
| 08010850_CustomerFrequencyShiftStatistics0801 |
|---|
| 0850_CustomerFrequencyShiftStatistics |
|---|
|
| Expand |
|---|
| title | 08010850_CustomerFrequencyShiftStatistics |
|---|
|
Image Removed Image Added Image Added Description: Report lists how often customer buys product in comparison to previous period time.list shift statistic for selected stores and period time Selections: - Date from – Default first day of a current weektoday
- Date to – Default today
- Compare date from - Default year ago from today
- Compate date to - Default year ago from today
- Region Store – Default allStore – Default all
Relevant parameters: - pDeletedStatuses - Comma separated list of statuses keys not to show in deleted receipts.
Output: amount, number of customers and sold items - shift statistic for each cashier with served customers, null sales and average amount for selected stores
, regions period time in comparison to previous selected Raport presents percentage differences and sum up all columns for selected stores- Report sum up customers, null sales, deleted amount, deleted quantity and average amount for each store.
Columns: - Store – Store number and store name
- Region- Team name
- Share – percentage net amount
- Ex. VAT – net amount
- Compared sales ex. VAT – Compared net amount
- Diff % - Percentage difference to compared date
- Customers num – Customer number
- Compared number of customers
- Diff % - Percentage difference to compared date
- Items per customer
- Compared items per customer
- Diff % - Percentage difference to compared date
- Avg. sales customer – Average sales customer
- Compared average sales per customer
- Diff % - Percentage difference to compared date
Clarifications: Diff % is percentage difference (increase or decrease) between date and comparable date- ShiftID
- Start – Shift start
- Stop – Shift end
- Cashier
- Customers – receipts count
- Nullsale – Total zero count
- Deleted amount – deleted receipts amount
- Deleted quantity – Deleted receipts quantity
- Avg amount – Average amount
Source: - Lindbak POS Reporting Cube (OLAP)
|
| Anchor |
|---|
| 08020851_SalesPerArticleGroupPaymentTypesPerShift0802 |
|---|
| 0851_SalesPerArticleGroupPaymentTypesPerShift |
|---|
|
| Expand |
|---|
| title | 08020851_SalesPerArticleGroupPaymentTypesPerShift |
|---|
|
Image Removed Image Added Image Added Description: Report lists sales per department and comparison sales in selected period of timeallow to follow up tender per shift. Report has two subreports, one settlement and second about statistics. Selections: Region – Default allStore – Default all- Date from – - Default today
- Date to – default - Default today
- Compare date from - Default the same day of week as Date from year before
- Compare date to - Default the same day of week as Date to but year before
- Department – Default all
- Article group – Default all
- Article subgroup – Default all
- Vendor – Default all
Output: - Report has a summary for each column for all selected departments.
- Summary totals in the beginning of new hierarchy level for:
- Department
- Article group
- Article subgroup
Columns: - Buttons for expanding and collapsing all drilldowns
- Department – Department number and name
- Share Ex. VAT – Sales Excluding VAT
- Compared sales ex. VAT – Compared sales excluding VAT
- Diff % - Difference percentage between sales excluding VAT
- Gross profit amt. – Gross profit amount
- Compared gross profit
- Gross profit % - Gross profit percentage
- Compared gross profit % - Compared gross profit percentage
- Diff. gr. prof. %-units – Difference gross profit percentage in units
- Quantity
- Compared quantity
- Average sales per customer inc VAT – Average sales per customer including VAT
- Discount ex. VAT – Discount excluding VAT
- Activity result – Activity result between discount exc. VAT and exc. VAT
- Retail Store - Default select a single store
- Workstation - Default all
- Shift - Default select a single value
Subreports: | Expand |
|---|
|  Image Added Image Added
Columns: - Tender type - payment method
- Received - Sales amount inc. VAT received in given tender type
- Balance - Money amount registered in the end of the day (sum for selected operators who made balance and selected days)
- Difference - Balance - Received
- Quantity - Number of items sold in given tender type
Output: One row per one tender type. Clarifications: - Balance and Difference make sense only for cash since only cash it's kept in cash register.
|
| Expand |
|---|
|  Image Added Image Added
Columns: - Description - Type of reason code
- Amount
- Quantity
- Share
Output: Subreport lists one row per one reason code type. |
Source: - Lindbak POS Reporting Cube (OLAP)
|
| Anchor |
|---|
| 08030900_SalesPerAssortmentMembersalesPerAssociation0803 |
|---|
| 0900_SalesPerAssortmentMembersalesPerAssociation |
|---|
|
| Expand |
|---|
| title | 08030900_SalesPerAssortmentMembersalesPerAssociation |
|---|
|
 Image AddedImage Removed Image AddedImage Removed
Description: Report lists member sales per assortment and comparison sales in selected period of timeassociation. Selections: - Region Loyalty program – Default allStore – Default allloyalty program
- Date from – Default today
- Date to – default today
- Compare date from - Default the same day of week as Date from year before
- Compare date to - Default the same day of week as Date to but year before
- Department – Default all
- Article group – Default all
- Article subgroup – Default all
- Vendor – Default all
- Default today
- Customer – Default Item number – Default empty
Output: - Report has a summary for each column for all selected stores.expand all and collapse all buttons for drilldowns.
- Totals Summary totals in the beginning of new hierarchy level for stores:
- Association No.
- Association
Columns: - Buttons for expanding and collapsing all drilldowns
- Store – Store name
- Region – Region team Share Ex. VAT – Sales Excluding VAT
- Compared ex. VAT – Compared sales excluding VAT
- Diff % - Difference percentage between sales and compared sales
- Gross profit amt. – Gross profit amount Compared gross profit
- Gross profit % - Gross profit percentage
- Compared gross profit % - Compared gross profit percentage
- Diff gr. prof. %-units – Difference gross profit percentage in units
- Quantity
- Compared quantity
- Average sales per customer inc. VAT – Average sales per customer including VAT
- Association
- No. Association
- Amount
- Bonus amount
- Members in period
- Linked members
Source: - Lindbak POS Reporting Cube (OLAP)
|
| Anchor |
|---|
| 0901_MemberDiscountGroup |
|---|
| 0901_MemberDiscountGroup |
|---|
|
| Expand |
|---|
| title | 0901_MemberDiscountGroup |
|---|
|
 Image Added Image Added
Description: Report lists new discount tgroup for member Selections: - Quarter – Default quarter 1
- Show – Default all (Changed discount group or unchanged discount group)
Output: Report shows customer discount group list for member Columns: - Customer num. – Customer number
- Customer – Customer name
- So far this year – Amount this year
- Estimated amount
- Discount group
- Estimated discount groupCompared average sales per customer inc. VAT – Compared average sales per customer including VAT
Source: Lindbak POS Reporting Cube (OLAP)
|
| Anchor |
|---|
| 08040902_DashBoardNewMembers0804 |
|---|
| 0902_DashBoardNewMembers |
|---|
|
| Expand |
|---|
| title | 08040902_DashBoardNewMembers |
|---|
|
Image Removed Image Added Image Added
Description: Report lists dashboard comparison sales, gross profit and customers with compare date for one day and the whole week.new member per week/month Selections: - Date Loyalty program – Default today
- Compare date – Default last week from today
- Team – Default all
- Store – Defaul all
- loyalty program
- Calculate per – Default per month
- Year – Default select a single value
Output: Report shows sales, gross profit and customers statistics for selected date and selected compared date. Appropriately report shows statistics for whole week for that selected day.Report has six Gauge panels which compared statistics from current hour in percentage.Columns: Sales – Whole day salesSales until 12 – Date sales to current hourCompared sales until 12 – Compared date sales to current hourGross profit – Whole day gross profitGross profit until 12 – Date gross profit to current hourCompared gross profit until 12 – Compared date gross profit to current hourCustomers – Whole day customer countCustomers until 12 – Date customer count to current hourtwo charts and one table for new members per week or per month. Columns: - Total number of members chart
- X-axis – Time
- Y-axis – Members – number of members
- New members per week/month chart
- X-axis – Time
- Y-axis – New members number
- Legend – Number of members for this year and last year
- New members per week table
- Week
- This year/Last year
- Increase – Number of new members
- Total
- Total increase
- Quantity – Difference between this year and last year
- Percent – Percentage difference between this year and last year
Clarifications: Negative values are marked red. Compared customers until 12 – Compared customer count to current hour Source: - Lindbak POS Reporting Cube (OLAP)DW
|
| Anchor |
|---|
| 08050903_LoyaltyClubSales_ReconciliationOfGiftcardsDW0805 |
|---|
| 0903_LoyaltyClubSales_ReconciliationOfGiftcardsDW |
|---|
|
| Expand |
|---|
| title | 0805_ReconciliationOfGiftcards | 0903_LoyaltyClubSales_DW |
|---|
|
Based on report 0107, but uses SQL instead of MDX  Image Added Image Added
Descriptions Image Removed Description: Report lists reconciliation of giftcardsloyalty club sales for selected stores depending on loyalty program and team. Selections: - Loyalty program – default 1
- Type – Default gift card
- GiftCard type- Default all
- Store – Default all
- Date from – Default today
- Date to – Default today
Output: Report shows reconciliation of giftcards with statistics for selected stores. Columns: - Store – Store number
- Issued – Sum amount issue
- Redeemed – Sum amount redeemed
- Accumulater expired balance
- Corrections – Corrections amount
Interactive sorting: Interactive sorting on all columns Source: |
...
| title | 0806_GiftcardsBalancePerStore |
|---|
Image Removed
Description:
Report lists giftcard balance per store.
Selections:
- Store – Default all
- Type – Default gift card
- GiftCard type – Default all
Output:
Report has a summary at the end of table.
Columns:
- Store – Store number
- Balance - ScripBalance
Source:
- Team – Default all
- Store – Default all
Relevant parameters: - pCustomerGroupsEmployees – Customer group used for employees, default 1.
Output: - One row per store.
- Raport show turnover, percentage of total sales, gross profit percentage and average quantity sold.
- Total sum of each column for selected stores.
Columns: - No – Store number
- Store – Store name
- Turnover
- Total – total mount
- Not member – Amount without Loyalty program
- Member – Amount with Loyalty program
- Employess – Amount with Customer group
- % of total sales
- Not member – percentage members without Loyalty program
- Member – percentage members with Loyalty program
- Gross profit %
- Total – percentage total of gross profit
- Not member – percentage of gross profit for members without Loyalty program
- Member – percentage of gross profit for members with Loyalty program
- Employess – percentage of gross profitt for members with customer group
- Average quantity sold
- Total – quantity of articles per customers
- Not member - quantity of articles per customers without Customer club
- Member - quantity of articles per customers with Customer club
Clarifications: Customer club refers to LoyaltyProgramKey and Employees refers to CustomerGroupKey. Gross profit is a value referred to NetCost deducted from NetAmount. Source: - Lindbak POS Reporting cube (OLAP)
- Lindbak POS Reporting DW
|
| Anchor |
|---|
| 0904_CashierStatistics |
|---|
| 0904_CashierStatistics |
|---|
|
| Expand |
|---|
| title | 0904_CashierStatistics |
|---|
|
CO: 154926  Image Added Image Added
Description: Report lists cashiers statistics for selected stores |
...
| Expand |
|---|
| title | 0807_GiftcardReconciliationPerStore |
|---|
|
Image Removed Description: Report lists reconciliation of giftcards per store. Selections: - Date from – Default today
- Date to – Default today
- Type Store – Default gift cardallStore
- Operator – Default alloperator
Output: One page per store. Report has table a summary for each store and summary column at the end of each column on that each store's table. Columns: - Giftcard number
- Issued amount
- Redeemed amount
- Balance correction amount
- Issued date
- Redeemed date
Interactive sorting: Interactive sorting on all columns.- Cashier No and Name – Cashier number and cashier name
- Returns quantity and amount
- Deleted receipts quantity and amount
- Deleted item lines quantity and amount
- Manual discounts quantity and amount
- Diff settlement amount – Difference settlement amount
- Deleted web order quantity and amount
- New customer orders quantity and amount
- Offline coupons quantity and amount
- Personnel disc. qty – Personnel discount quantity
Source: - Lindbak RetailPOS Reporting Cube (OLAP)
|
| Anchor |
|---|
| 08080950_MemberAndElectronicCommunicationBonusPerStorePerEndOfMonth0808 |
|---|
| 0950_MemberAndElectronicCommunicationBonusPerStorePerEndOfMonth |
|---|
|
| Expand |
|---|
| title | 08080950_MemberAndElectronicCommunicationBonusPerStorePerEndOfMonth |
|---|
|
RTC-27636 / CO-99244, PBI#155899222611 Image Removed Image Added Image Added Description: Report lists members and e-mail/SMS subscriptionsshows information about issued, redeemed and balance for bonus checks, per month and store for the last 12 months. Selections: - Loyalty program – Default Loyalty program- Default 1
- Team - Default all
- Store – - Default all available in selected teams
Output: Report shows members with e-mail/SMS subscriptions, one row per store with summary of each column. Columns: - Store – Store number and store name
- Members – Members quantity
- Email – Email quantity
- Mobile – Mobile quantity
One page per store. For each month sum of issued, redeemed, balance and expired bonus checks. One sum for manual issued checks, checks issued from sales and total. First page of report is total for all stores. Columns: - End of month - Shows last date in each month for the last 12 months.
- Bonus type - For each month there is one row for manual issues checks, checks issued from sales and total.
- Issued - Sum of bonus amount issued.
- Redeemed - Sum of redeemed bonus amount.
- Balance - Sum of not exipred, not used bonus amount.
- Expired Sum of bonus amount expired at the end of month.
Sorting: Source:
|
| Anchor |
|---|
| 08090951_SecurityReport_LoyaltyStatisticsDW0809 |
|---|
| 0951_SecurityReport_LoyaltyStatisticsDW |
|---|
|
| Expand |
|---|
| title | 08090951_SecurityReport_LoyaltyStatisticsDW |
|---|
|
CO-99233, PBI#155902. Based on report 0519 Image RemovedDescription: lists loyalty statistics. Selections: - Loyalty program – Default loyalty program
- Date from – Default today
- Date to – Default today
- Store – Default all
Output: Report is divided on 4 tables and 2 charts. Every table has a stotal sumamry at the end table for each column. Columns: - New members in period table
- Sex – Female, male and unknown
- This year – Number of new members
- Last year – Number of new members last year
- New member in period circle chart
- This year – New member this year
- Last year – New member last year
- Sales statistics table
- Member and not member rows
- Num of receipts – Number of receipts
- Tot. sales amt. – Total sales amount
- Avg amount – Average amount
- Items – Items quantity
- Items/cust – Number of items over number of sales for members.
- Gross profit
- Gr. prof. % - Gross profit percentage
- Sales by gender/age groups table
- Age group
- Male/Female
- Sales – Sales amount
- Gross profit
- Gr. prof. % - Gross profit percentage
- Sales by gender/age groups chart
- X – axis – Age group
- Y – axis – Sales amount
- Legend – Male and Female bars
- Sales by gender/department table
- Department
- Sales amount
- Male – Male sales amount
- Female – Female sales amount
- Unknown – Unknown sales amount
- Total – Total amount for all genders
- Total %
- Male – Male sales amount percentage
- Female – Female sales amount percentage
- Unknown – Unknown sales amount percentage
- Total – Total sales amount for all genders percentage
Source: - Lindbak POS Reporting Cube (OLAP)
- Lindbak POS Reporting DW
|
...
| title | 0810_LoyaltyClubSales |
|---|
CO-92729, PBI#155905
Image Removed
Description:
Report lists sales in selected stores in loyalty clubs. Report also present turnover chart.
Selections:
- Loyalty program – Default first loyalty program
- Date from – Default today
- Date to – Default today
- Team – Default all
- Store – Default all
- Department – Default all
Output:
- Report shows sales statistics in loyalty club for selected stores. Report has a summary at the end of each column.
- Report has a turnover bar chart. On x-axis are turnover information bars: total, not member, member and employees. On y-axis is turnover amount.
Columns:
- No – Store number
- Store – Store name
- Turnover
- Total – Total turnover amount
- Not member – Turnover amount without members
- Member - Turnover amount with members
- Employees – Turnover employees amount
- % of total sales
- Not member – Percentage of total sales without members
- Member - Percentage of total sales with members
- Gross profit %
- Total – Total gross profit percentage
- Not member – Total gross profit percentage without members
- Member - Total gross profit percentage with members
- Employees – Total gross profit percentage
- Average quantity sold
- Average sale in sum
Source:
- Lindbak POS Reporting Cube (OLAP)
- allows to monitor security-sensitive activities performed by cashiers/operators in the store, including manual discounts, returns, gift card transactions, and voucher usage.
Selections:- Date from: Default yesterday
- Date to: Default yesterday
- Retail store: Single select on store (because of performance). Default first available.
- Operator: Default all operators for the selected store
Output:Security activity statistics shown individually per each cashier security-relevant activities like manual discounts, returns, gift card sales/redemptions, and voucher usage with reference to receipt number. Additionally there are totals for each operator and each store. Columns:- Retail Store - Store identifier and name
- Manual discounts - Sum of manual discount amounts (line and sub-total discounts)
- Manual returns - Quantity of items returned without reference to original transaction
- Online returns - Quantity of items returned with reference to original transaction
- Giftcards out - Quantity of gift cards sold
- Giftcards in - Count of gift card redemptions/usage
- Voucher/coupon used - Count of voucher/coupon usage transactions
Sorting:- Retail Store (default)
- Operator Display
- Transaction ID
Source:- Lindbak POS Reporting DW - Data Warehouse database
|
| Anchor |
|---|
| 0952_ItemQuantityStores |
|---|
| 0952_ItemQuantityStores |
|---|
|
| Expand |
|---|
| title | 0952_ItemQuantityStores |
|---|
|
RTP-43325 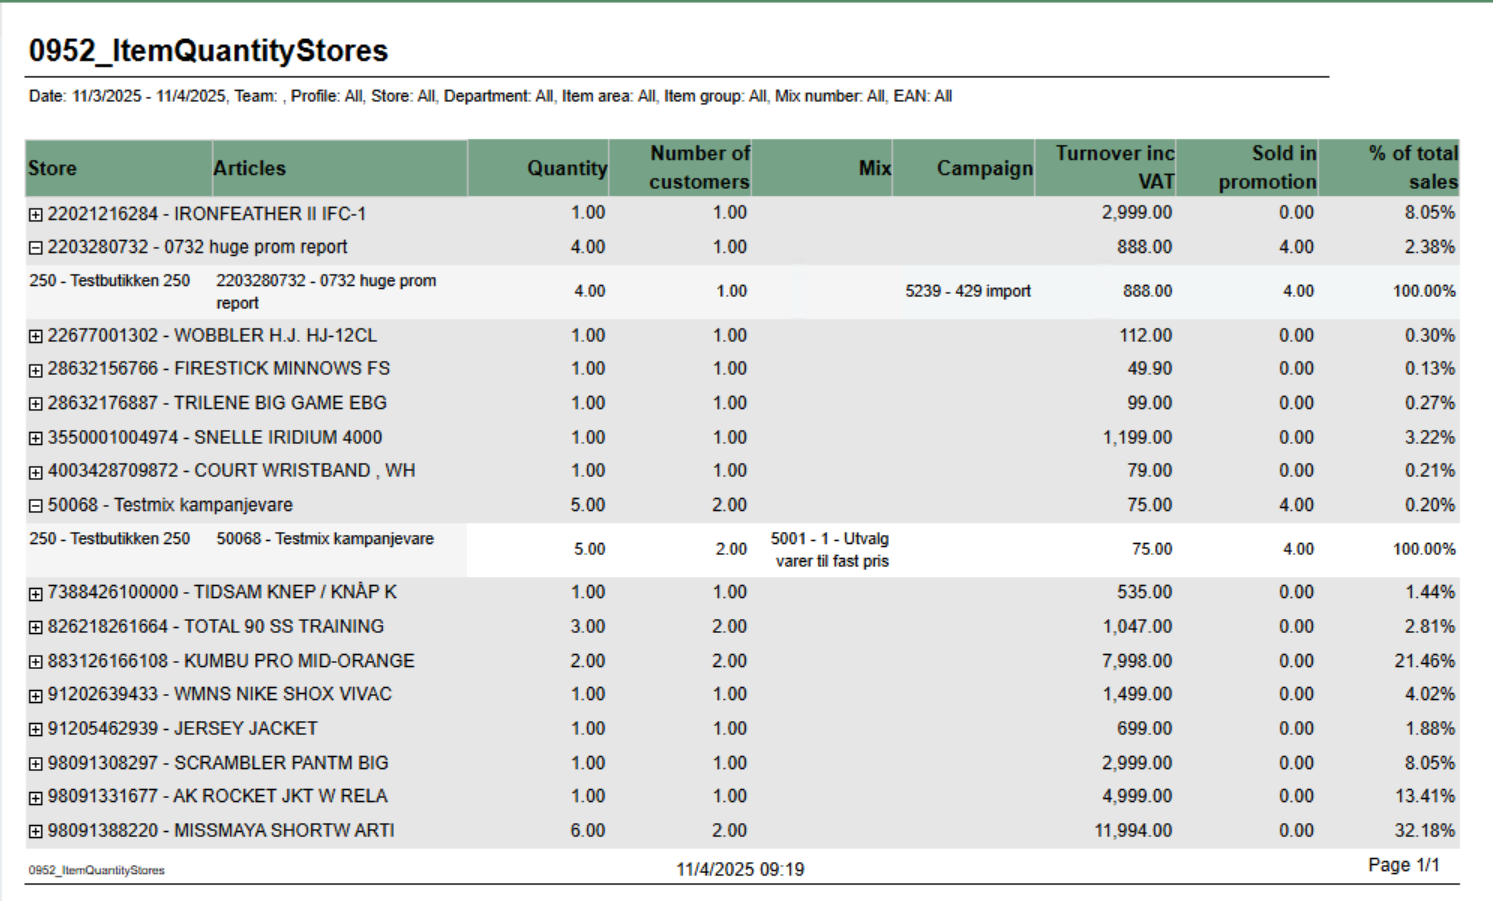 Image Added Image Added
Description: Report displays item quantity sales data aggregated by retail store with support for mix and campaign analysis. It provides detailed sales information including quantity sold, number of customers, turnover, and promotional sales breakdown. The report allows drill-down from article level to individual store performance. Selections: - Date from: Default today
- Date to: Default today
- Team: Multivalue; default all
- Profile: Multivalue; default all
- Store: Multivalue; default all (filtered by Team selection)
- Department: Multivalue; default all
- Article area: Multivalue; default all
- Article group: Multivalue; default all
- Mix: Multivalue; default all
- EAN list: Text input; default empty (comma-separated list of EAN codes)
- Include VAT: Boolean; default true (toggles between amounts including/excluding VAT)
- Expand all: Boolean; default false (when true, automatically expands all article groups to show store details)
Output: Article sales statistics grouped by EAN with drill-down capability to individual store level. Report shows: - Summary row per article (EAN) with aggregated data across all stores
- Detail rows per store showing individual store performance (visible when expanded)
- Mix numbers and campaign information displayed as comma-separated lists when multiple values exist
Columns: - Retail Store: Article EAN and name (at summary level)
- Articles: Article EAN and name (at detail level)
- Quantity: Total quantity sold
- Customers: Distinct receipt count (number of customers)
- Mix: Mix numbers and names (comma-separated if multiple mixes apply to the article-store combination)
- Campaigns: Campaign numbers and names (comma-separated if multiple campaigns apply)
- Turnover: Total sales amount (with or without VAT based on Include VAT parameter)
- Sold in Promotion: Quantity sold with discounts/campaigns (calculated as: Total Quantity - Quantity Not Discounted)
- % of Total Sales: Percentage of article turnover compared to total report turnover
Sorting: - Primary: EAN (ascending)
- Secondary: Retail Store Number (ascending)
Clarifications: - Quantity Not Discounted logic: Shows quantity only when Mix is 1, -1, or Unknown AND Campaign is Adhoc, NoCampaign, Not Available, or Unknown. Otherwise returns NULL.
- Mix and Campaign Display: Uses LookupSet function to aggregate multiple mixes/campaigns per article-store combination with "|" delimiter for matching
- Parameter Dependencies: Store parameter options are dynamically filtered based on Team selection
|
...
| Expand |
|---|
| title | 0850_ShiftStatistics |
|---|
|
Image Removed Description: Report list shift statistic for selected stores and period time Selections: - Date from – Default today
- Date to – Default today
- Store – Default all
Relevant parameters: - pDeletedStatuses - Comma separated list of statuses keys not to show in deleted receipts.
Output: - Report shows shift statistic for each cashier with served customers, null sales and average amount for selected stores and period time.
- Report sum up customers, null sales, deleted amount, deleted quantity and average amount for each store.
Columns: - Store – Store number and store name
- ShiftID
- Start – Shift start
- Stop – Shift end
- Cashier
- Customers – receipts count
- Nullsale – Total zero count
- Deleted amount – deleted receipts amount
- Deleted quantity – Deleted receipts quantity
- Avg amount – Average amount
Source: - Lindbak POS Reporting Cube (OLAP)
|
| Anchor |
|---|
| 08514000_PaymentTypesPerShiftItemSaleQuantityReport0851 |
|---|
| 4000_PaymentTypesPerShiftItemSaleQuantityReport |
|---|
|
| Expand |
|---|
| title | 0851_PaymentTypesPerShift | 4000_ItemSaleQuantityReport |
|---|
|
RTC-46626 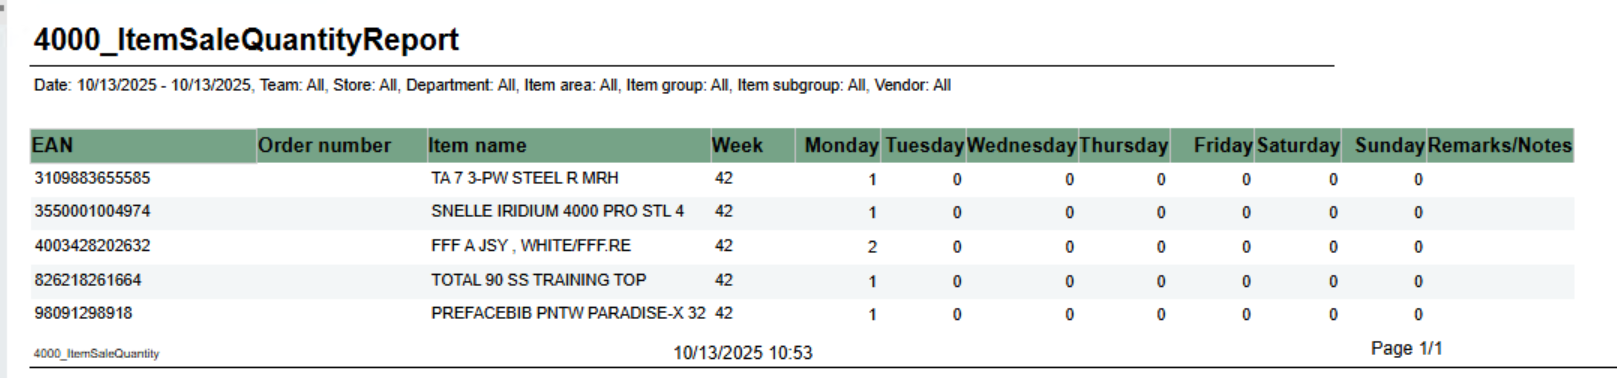 Image AddedImage Removed Image AddedImage Removed
Description: Report allow to follow up tender per shift. Report has two subreports, one settlement and second about statistics. Selections: - Date from - Default today
- Date to - Default today
- Retail Store - Default select a single store
- Workstation - Default all
- Shift - Default select a single value
Subreports: | Expand |
|---|
| Image Removed Columns: - Tender type - payment method
- Received - Sales amount inc. VAT received in given tender type
- Balance - Money amount registered in the end of the day (sum for selected operators who made balance and selected days)
- Difference - Balance - Received
- Quantity - Number of items sold in given tender type
Output: One row per one tender type. Clarifications: - Balance and Difference make sense only for cash since only cash it's kept in cash register.
|
| Expand |
|---|
|
|
Image Removed
Columns:
- Description - Type of reason code
- Amount
- Quantity
- Share
Output:
Subreport lists one row per one reason code typeshows number of sold items per day of week. Grouped by week.
Selections:
- From date - default first date of current week.
- To date - default today
- Team - default all
- Retail store - default all
- Department - default all
- Article area - default all
- Article group - default all
- Article subgroup - default all
- Vendor - default all
Note that is is possible to select default e.g article groups by selecting group(s) in parameter pArticleGroup
Output:
One row for ean item with columns for each day of week. In addition one column for notes.
Columns:
- EAN - EAN
- Item ID - Item number
- Item name - Item name
- Week - Week number
- Monay - Friday - One column for each day
- Remarks / Notes - Empty column.
Source:
Lindbak POS Reporting Cube (
OLAPOlap)
| Anchor |
|---|
| 09004001_MembersalesPerAssociationHourlySalesReport0900 |
|---|
| 4001_MembersalesPerAssociationHourlySalesReport |
|---|
|
| Expand |
|---|
| title | 0900_MembersalesPerAssociation |
|---|
| Image Removed
Description:
Report lists member sales per association.
Selections:
- Loyalty program – Default loyalty program
- Date from – Default today
- Date to – Default today
- Customer – Default empty
Output:
- Report has expand all and collapse all buttons for drilldowns.
- Totals in the beginning of new hierarchy level for:
- Association No.
- Association
Columns:
- Buttons for expanding and collapsing all drilldowns
- Association
- No. Association
- Amount
- Bonus amount
- Members in period
- Linked members
Source:
- Lindbak POS Reporting Cube (OLAP)
...
|
RTC-46798  Image Added Image Added
Description: Report lists sale statistics for total sales also sales statistics for member and campaign sales. Graph in bottom showing Total, campaign and member sales. Report show only hours with sales. Selections: - Date from - default today
- Date to - default today
- Hour from - default 0 (start of hour, meaning 0 is between 0 and 1.
- Hour from - default 23 (start of hour, meaning 23 is between 23 and 00.
- Profile - default All
- Team - default All
- Retail store - default All
- Department - default All
- Article area - default All
- Article group - default All
- EAN list - default empty
Output: One row per hour with sale. One page per store and one for All stores. Bottom of page showing graph for Total-, Campaign- and Member-sales. Columns: - Hour - Showing from - to hour.
- Total
- Amount - Sales amount including VAT
- Net cost - Net cost
- VAT amount - VAT amount
- Gr. profit % - Gross profit in percentage
- Total % - Share of sales for this hour
- Article count - Number of articles sold
- Customer count - Number of receipts / customers
- Sales / Customer - Average sales per customer
- Sales / Item - Average sales amount per item
- Articles / Customer - Average items per customer / receipt
- Members (where there is member in receipt)
- Sales amount - Sales amount including VAT
- Articles - Number of articles
- Customer - Number of customers
- Campaign (where there is discount type Campaign)
- Sales amount - Sales amount including VAT
- Articles - Number of articles
- Customer - Number of customers
Sorting: Sorted by hour, earliest first. |
...
| Expand |
|---|
| title | 0901_MemberDiscountGroup |
|---|
|
Image Removed
Description: Report lists new discount tgroup for member Selections: - Quarter – Default quarter 1
- Show – Default all (Changed discount group or unchanged discount group)
Output: Report shows customer discount group list for member Columns: - Customer num. – Customer number
- Customer – Customer name
- So far this year – Amount this year
- Estimated amount
- Discount group
- Estimated discount group
Source: Lindbak POS Reporting Cube (OLAPOlap) |
| Anchor |
|---|
| 09024002_NewMembersRevenueReport0902 |
|---|
| 4002_NewMembersRevenueReport |
|---|
|
| Expand |
|---|
| title | 0902_NewMembers | 4002_RevenueReport |
|---|
|
RTC-46685  Image AddedImage Removed Image AddedImage Removed
Description: Report lists new member per week/month Selections: - Loyalty program – Default loyalty program
- Calculate per – Default per month
- Year – Default select a single value
Output: Report shows two charts and one table for new members per week or per month. Columns: - Total number of members chart
- X-axis – Time
- Y-axis – Members – number of members
- New members per week/month chart
- X-axis – Time
- Y-axis – New members number
- Legend – Number of members for this year and last year
- New members per week table
- Week
- This year/Last year
- Increase – Number of new members
- Total
- Total increase
- Quantity – Difference between this year and last year
- Percent – Percentage difference between this year and last year
Clarifications: Negative values are marked red. Source: |
...
| title | 0903_LoyaltyClubSales_DW |
|---|
Based on report 0107, but uses SQL instead of MDX
Image Removed
Descriptions:
Report lists loyalty club sales for selected stores depending on loyalty program and team.
Selections:
- Loyalty program – default 1
- Date from – Default today
- Date to – Default today
- Team – Default all
- Store – Default all
Relevant parameters:
- pCustomerGroupsEmployees – Customer group used for employees, default 1.
Output:
- One row per store.
- Raport show turnover, percentage of total sales, gross profit percentage and average quantity sold.
- Total sum of each column for selected stores.
Columns:
- No – Store number
- Store – Store name
- Turnover
- Total – total mount
- Not member – Amount without Loyalty program
- Member – Amount with Loyalty program
- Employess – Amount with Customer group
- % of total sales
- Not member – percentage members without Loyalty program
- Member – percentage members with Loyalty program
- Gross profit %
- Total – percentage total of gross profit
- Not member – percentage of gross profit for members without Loyalty program
- Member – percentage of gross profit for members with Loyalty program
- Employess – percentage of gross profitt for members with customer group
- Average quantity sold
- Total – quantity of articles per customers
- Not member - quantity of articles per customers without Customer club
- Member - quantity of articles per customers with Customer club
Clarifications:
Customer club refers to LoyaltyProgramKey and Employees refers to CustomerGroupKey. Gross profit is a value referred to NetCost deducted from NetAmount.
Source:
- Lindbak POS Reporting cube (OLAP)
- Lindbak POS Reporting DW
showing revenue per cash regsiter for store with sale. Selections: - Date from - default today
- Date to - default today
- Profile - default all
- Team - default all
- Retail store - default all
Output: One row for each workstation in store with statistics about customers and sales. NB! Showing all cash registers for store but only stores with sales. Also showing total per store and total nonsale per store. Columns: - Customers - Number of customer/receipts
- Sales / customer - Average sale per customer/receipt
- Articles / customer - Average article per customer/receipt
- GR + return - Gross sales including return. Gross sales is sales including depositrefunt
- Amount - Sales amount including VAT
Source: Lindbak POS Reporting Cube (Olap) |
| Anchor |
|---|
| 4003_HourlySalesPerItem |
|---|
| 4003_HourlySalesPerItem |
|---|
|
| Expand |
|---|
| title | 4003_HourlySalesPerItem |
|---|
|
RTC-46808  Image Added Image Added
Description: Report showing number of sold items per hour for selected date. Also showing total for hierarchy. Selections: - Date - single selction of date, default today
- Hour from - Showing only hours from selected hour. Hour in selection is start of hour (7 is hour 7-8). Default 7. Default can be changed by parameter pHourFrom
- Hour to - Showing only hours to selected hour. Hour in selection is start of hour (23 is hour 23-00). Default 23. Default can be changed by parameter pHourTo
- Profile - default All
- Team - default All
- Retail store - default All
- Department - default All
- Article area - default All
- Article group - default All
Not that is is possible to select default e.g article groups by selecting group(s) in parameter pArticleGroup Output: One row per item with total for group, area and department. Columns: - EAN - EAN
- Item name - Item name
- Vendor number - Vendor number
- Date - Date selected
- One column for each selected hour
Source: Lindbak POS Reporting Cube (Olap) |
| Anchor |
|---|
| 4004_SalesByDepartmentAreaAndGroup |
|---|
| 4004_SalesByDepartmentAreaAndGroup |
|---|
|
| Expand |
|---|
| title | 4004_SalesByDepartmentAreaAndGroup |
|---|
|
RTC-46772  Image Added Image Added
Description: Report showing statistics about sales, gross profit and discount. Report is either on department, are or group depending on selection. Also share of gross profit and sales for department and store. Selections: - Date from - default today
- Date to - default today
- Department - default all
- Article area - default all
- Article group default all
- Profile - default all
- Team - default all
- Retail store - default all
- Report type - Which lever of hierarchy report will be created on. Default Department.
Output: One line per level of selected hierarcy with total for department. Columns: - Cost price - Net cost
- Sales - Sales amount including VAT
- Gr.prof. - Gross profit in amount
- GP% - Gross profit in percentage
- Customer disc. - Customer grup discount
- Eployee discount - Personal discount
- General discount - Other discounts except customer and personal
- Gross sales - Sales amount including depositdefund items
- Department
- Part of sales - Percentage part of sales per department
- Part of GP - Percentage part of gross profit per department
- Store
- Part of sales - Percentage part of sales per store
- Part of GP - Percentage part of gross profit per store
|
...
| Expand |
|---|
| title | 0904_CashierStatistics |
|---|
|
CO: 154926 Image Removed Description: Report lists cashiers statistics for selected stores. Selections: - Date from – Default today
- Date to – Default today
- Store – Default all
- Operator – Default operator
Output: One page per store. Report has a summary for each column at the end each store's table. Columns: - Cashier No and Name – Cashier number and cashier name
- Returns quantity and amount
- Deleted receipts quantity and amount
- Deleted item lines quantity and amount
- Manual discounts quantity and amount
- Diff settlement amount – Difference settlement amount
- Deleted web order quantity and amount
- New customer orders quantity and amount
- Offline coupons quantity and amount
- Personnel disc. qty – Personnel discount quantity
Source: Lindbak POS Reporting Cube ( OLAPOlap) |
| Anchor |
|---|
| 09504005_BonusPerStorePerEndOfMonthSafetyReport0950 |
|---|
| 4005_BonusPerStorePerEndOfMonthSafetyReport |
|---|
|
| Expand |
|---|
| title | 09504005_BonusPerStorePerEndOfMonth |
|---|
| RTC-27636 / CO-222611
Image Removed
Description:
Report shows information about issued, redeemed and balance for bonus checks, per month and store for the last 12 months.
Selections:
- Loyalty program - Default 1
- Team - Default all
- Store - Default all available in selected teams
Output:
One page per store. For each month sum of issued, redeemed, balance and expired bonus checks. One sum for manual issued checks, checks issued from sales and total. First page of report is total for all stores.
Columns:
- End of month - Shows last date in each month for the last 12 months.
- Bonus type - For each month there is one row for manual issues checks, checks issued from sales and total.
- Issued - Sum of bonus amount issued.
- Redeemed - Sum of redeemed bonus amount.
- Balance - Sum of not exipred, not used bonus amount.
- Expired Sum of bonus amount expired at the end of month.
Sorting:
Source:
...
|
RTC-47002  Image Added Image Added
Description: Report showing statistics per cashier in store. Because of performence report has single selct on store. NB! Report require minimum reporting v84 Selections: - Date from - default today
- Date to - default today
- Profile - defalt all
- Team - default all
- Retail store - single selct, first available store selected
- Operator - defalt all for selected store
- Cashiers with no sale - default off. If on report will list all cashiers from store even if no sales
Hidden parameters: - pDeletedArticlesStatuses - Which deleted status will be included in row for Deleted items. Default: 2 - Deleted,12 - Deleted is last registered, 13 - Deleted is last remaining,14 - Deleted is last remaining and is last registered
- pDeletedOtherStatuses - Which deleted status will be included in row for Deleted other. Default: 7 - Deleted from on hold, 10 - Deleted in on hold from on hold, 15 - Deleted unfinished receipt, 16 - Deleted from unfinished receipt
- pDeletedReceiptStatuses - Which deleted status will be included in row for Deleted receipt. Default: 3 - Delted receipt
- pGeneralDiscount - Which discount types will be included in row for General discount. Default: 2 - Line discount, 3 - Group discount, 4 - Customer group discount, 5 - Adhoc package, 6 - Model discount, 7 - Member discount, 8 - Campaign discount, 9 - Giftcard discount, 10 - Personal discount, 11 - Subtotal discount
- pManualDepositRefundInArtEAN - Comma separated list of items which will be included in row for Deposit refund manual. Default 99
Output: Rows for data with one column for each operator. Rows: - Store - Storename and number
- Cashier - Cashier name and number
- Net amount - Net amount sales
- Quantity - Number of articles sold
- Sale/cust - Average sale per customer
- Item/cust - Average items per customer
- Total items open ex. PLU - Items sold without open price
- Total items open PLU - Items sold with open price
- Nullsale - Number of receipts finished with salesamount 0
- Total credit sales Amount - Amount sold on tendertype Credit
- Total credit sales - Number of sales with tendertype Credit
- Giftcards out Amount - Amount of sold gift cards (sale with articletype giftcard)
- Giftcards out - Number of gift cards sold (sale with articletype giftcard)
- Returned items Amount - Amount of returned items (sales with direction in)
- Returned items - Quantity of returned items (sales lines with direction in)
- General discount Amount - Sum of discount for discount types set in parameter pGeneralDiscount
- General discount - Quantity of items with discount types set in parameter pGeneralDiscount
- Deleted items Amount - Amount of deleted items with deleted status from parameter pDeletedArticlesStatuses
- Deleted items - Quantity of deleted items with deleted status from paramter pDeletedArticlesStatuses
- Deleted other Amount - Amount of deleted items with deleted status from parameter pDeletedOtherStatuses
- Deleted other - Quantity of delted items with deleted status from parameter pDeletedOtherStatuses
- Deleted receipt Amount - Amount of deleted receipts with deleted status from parameter pDeletedReceiptStatuses
- Deleted receipt - Quanity of deleted receipts with deleted status from parameter pDeletedReceiptStatuses
- Deposit - Number of deposit sales
- Difference - Difference between cash from balance and cash from tender
- Received deposit refund (manual) Amount - Sum of sales with direction In from articles with article type = depositrefund where article is in parameter pManualDepositRefundInArtEAN
- Received deposit refund (manual) - Quantity of items with direction In from articles with article type = depositrefund where article is in parameter pManualDepositRefundInArtEAN
- Received deposit refund (auto) Amount - Sum of sales with direction In from articles with article type = depositrefund where article is NOT in parameter pManualDepositRefundInArtEAN
- Received deposit refund (auto) - Quantity of items with direction In from articles with article type = depositrefund where article is NOT in parameter pManualDepositRefundInArtEAN
Source: |
...
| Expand |
|---|
| title | 4000_ItemSaleQuantityReport |
|---|
|
RTC-46626  Image Removed Image Removed
Description: Report shows number of sold items per day of week. Selections: - From date - default first date of current week.
- To date - default today
- Team - default all
- Retail store - default all
- Department - default all
- Article area - default all
- Article group - default all
- Article subgroup - default all
- Vendor - default all
Note that is is possible to select default e.g article groups by selecting group(s) in parameter pArticleGroup Output: One row for ean item with columns for each day of week. In addition one column for notes. Columns: - EAN - EAN
- Item ID - Item number
- Item name - Item name
- Monay - Friday - One column for each day
- Remarks / Notes - Empty column.
Source: Lindbak POS Reporting Cube (Olap)
|
| Anchor |
|---|
| 40014006_HourlySalesReportDifference4001 |
|---|
| 4006_HourlySalesReportDifference |
|---|
|
| Expand |
|---|
| title | 40014006_HourlySalesReportDifference |
|---|
|
RTC-4679847005 Image Removed Image Added Image Added Description: Report lists sale statistics for total sales also sales statistics for member and campaign sales. Graph in bottom showing Total, campaign and member sales. Report show only hours with sales. comparing basic sales between two stores with date selection for each store. Selections: - Date from -
default - Start date for reference store. Default today
- Date to -
default - End date for reference store. Default today
- Hour from - default 0 (start of hour, meaning 0 is between 0 and 1.
- Hour from - default 23 (start of hour, meaning 23 is between 23 and 00.
- Profile - default All
- Team - default All
- Retail store - default All
- Compare date from - Start date for comparing store. Default today
- Compare date to - End date for comparing store. Default today
- Retail store ref - Reference store. Default all
- Retail store comp - Comparing store. Default all
- Department - default all
Department - default All- Article area - default
All- all
- Article group - default
All- all
EAN list - default empty- Article subgroup - default all
- Statistic - Which level of hierarcy to run report for. Department, Area, Group, SubGroup and Item. Default Department.
Output: One row per hour with sale. One page per store and one for All stores. Bottom of page showing graph for Total-, Campaign- and Member-salesfor each level of selected hierarchy. Totals for all level of hierarchy above selected. Hierarchy above selected is colored dark grey. Columns: - Item
- Number and name of hierarchy.
- Reference store with date selections.
- Sales ex/VAT - Sales excluding VAT
- Gr.prof. - Gross profit
- Gr.prof.
- Hour - Showing from - to hour.
Total- Amount - Sales amount including VAT
- Net cost - Net cost
- VAT amount - VAT amount
Gr. profit - % - Gross profit in percentage
- Total % - Share of sales for this hour
- Article count - Number of articles sold
- Customer count - Number of receipts / customers
- Sales / Customer - Average sales per customer
- Sales / Item - Average sales amount per item
- Articles / Customer - Average items per customer / receipt
- Members (where there is member in receipt)
- Sales amount - Sales amount including VAT
- Articles - Number of articles
- Customer - Number of customers
- Campaign (where there is discount type Campaign)
- Sales amount - Sales amount including VAT
- Articles - Number of articles
- Customer - Number of customers
Sorting: Sorted by hour, earliest first.- Comparing store with date selections
- Sales ex/VAT - Sales excluding VAT
- Gr.prof. - Gross profit
- Gr.prof. % - Gross profit in percentage
- Difference
- Sales ex/VAT - Difference between reference store and comparing store
- Gr.prof. - Difference between reference store and comparing store
- Gr.prof. % - Difference between reference store and comparing store
Source: Lindbak POS Reporting Cube (Olap)
|
| Anchor |
|---|
| 40024007_RevenueReportShortCashierReport4002 |
|---|
| 4007_RevenueReportShortCashierReport |
|---|
|
| Expand |
|---|
| title | 40024007_RevenueReportShortCashierReport |
|---|
|
RTC-4668547013 Image Removed Image Added Image Added Description: Report showing revenue per cash regsiter for store with sale.giving information about revenue payment methods and settlement for cashiers Selections: - Date from - default today
- Date to - default today
Profile - Team - default all
Team - Profile - default all
- Retail store - default all
- Operator - default all for selected store(s)
Output: One Grouped by store with one row for each workstation in store with statistics about customers and sales. NB! Showing all cash registers for store but only stores with sales. Also showing total per store and total nonsale per storecashier. Columns: - Cashier - <storenum>-<cashiernum>
- First name - First name of cashier
- Last name - Last name of cashier
- Registered revenue - Sales amount including VAT
- Bank card - Tender used with bank card (CreditDebit)
- Credit - Tender used with Credit
- Paid in - Controltransaction with Paid in
- Drop / paid out - Controltransactions with Drop and paid out
- Other payment methods - Tender with tender types not mentioned above or below.
- Received cash/check - Tender used with Cash and Check
- Cash settlement - Balance transaction with tender type Cash and Check
- Difference - Difference between Cash Settlement and Received cash/check
- Customers - Number of customer/receipts
- Sales / customer - Average sale per customer/receipt
- Articles / customer - Average article per customer/receipt
- GR + return - Gross sales including return. Gross sales is sales including depositrefunt
Amount - Sales amount including VAT
Source: Lindbak POS Reporting Cube (Olap) |
| Anchor |
|---|
| 40034008_HourlySalesPerItemCashRegisterReport4003 |
|---|
| 4008_HourlySalesPerItemCashRegisterReport |
|---|
|
| Expand |
|---|
| title | 40034008_HourlySalesPerItemCashRegisterReport |
|---|
|
RTC-4680847014 Image Removed Image Added Image Added Description: Report showing number of sold items per hour for selected date. Also showing total for hierarchy.giving information about revenue payment methods and settlement for cash registers Selections: - Date from -
single selction of date, - default today
- Hour from - Showing only hours from selected hour. Hour in selection is start of hour (7 is hour 7-8). Default 7. Default can be changed by parameter pHourFrom
- Hour to - Showing only hours to selected hour. Hour in selection is start of hour (23 is hour 23-00). Default 23. Default can be changed by parameter pHourTo
- Profile - default All
- Date to - default today
- Team - default all
- Profile - default all
Team - default All- Retail store - default
All- all
- Department - default All
- Article area - default All
- Article group - default All
Not that is is possible to select default e.g article groups by selecting group(s) in parameter pArticleGroup- Workstation - default all for selected store(s)
Output: One row per item with total for group, area and departmentGrouped by store with one row for each workstation. Columns: - Workstation - <storenum>-<workstationnum>
- Registered revenue - Sales amount including VAT
- Bank card - Tender used with bank card (CreditDebit)
- Credit - Tender used with Credit
- Paid in - Controltransaction with Paid in
- Drop / paid out - Controltransactions with Drop and paid out
- Other payment methods - Tender with tender types not mentioned above or below.
- Received cash/check - Tender used with Cash and Check
- Cash settlement - Balance transaction with tender type Cash and Check
- Difference - Difference between Cash Settlement and Received cash/check
- EAN - EAN
- Item name - Item name
- Vendor number - Vendor number
- Date - Date selected
One column for each selected hour
Source: Lindbak POS Reporting Cube (Olap)
|
| Anchor |
|---|
| 40044009_SalesByDepartmentAreaAndGroupCustomerOrderHistory4004 |
|---|
| 4009_SalesByDepartmentAreaAndGroupCustomerOrderHistory |
|---|
|
| Expand |
|---|
| title | 40044009_SalesByDepartmentAreaAndGroupCustomerOrderHistory |
|---|
|
RTC-4677247198 Image Removed Image Added Image Added Description: Report showing statistics about sales, gross profit and discount. Report is either on department, are or group depending on selection. Also share of gross profit and sales for department and storeshoing history of order header and order lines. Mainly used for showing deletion of order, order lines and price reduction on order lines. Selections: - Date from - default today - 7 days.
- Date to - default today
- Department - default all
- Article area - default all
Article group default all- Show only changes - Changes means only showing deleted orders, deleted orderlines and order lines with price reduction. If false we are showing all history on order lines. Default true
- Profile - default
all- All
- Team - default
all- All
- Retail store -
default allReport type - Which lever of hierarchy report will be created on. Default Department.- Default All (filtered also by profile and team)
Output: One line per level of selected hierarcy with total for departmentGrouped by store, order and order line. Showing transaction information, status, item information and prices per row for each order line. Columns: - Transactions - Receipt ID where where changes occured.
- Transaction date - Enddate from poslog where changes occured.
- Status - Type of change. Deleted order, Deleted order line, Price reduction or Not deleted (Other changes than mentioned can be included in this status).
- Cashier - Cashier number and name
- Customer
- Customer num. - Customer number
- Name - Customer name
- Item
- EAN - EAN
- Item name - Item name
- Quantity - Quantity
- Sales amount
- Sales amount - Sales amount of order line. If price reduction this shows before price.
- New sales amount - Sales amount of order line. If price reduction this shows new sales price.
- Order sales amount - Total sales amount of order (from order header)
- Cost price - Net cost
- Sales - Sales amount including VAT
- Gr.prof. - Gross profit in amount
- GP% - Gross profit in percentage
- Customer disc. - Customer grup discount
- Eployee discount - Personal discount
- General discount - Other discounts except customer and personal
- Gross sales - Sales amount including depositdefund items
- Department
- Part of sales - Percentage part of sales per department
- Part of GP - Percentage part of gross profit per department
Store - Part of sales - Percentage part of sales per store
Part of GP - Percentage part of gross profit per store
Source: Lindbak POS Reporting Cube (Olap) Lindbak POS Reporting DW (SQL database) |
| Anchor |
|---|
| 40054010_SafetyReportStoreSettlementPerWorkstation4005 |
|---|
| 4010_SafetyReportStoreSettlementPerWorkstation |
|---|
|
| Expand |
|---|
| title | 40054010_SafetyReportStoreSettlementPerWorkstation |
|---|
|
RTC-4700249375 Image Removed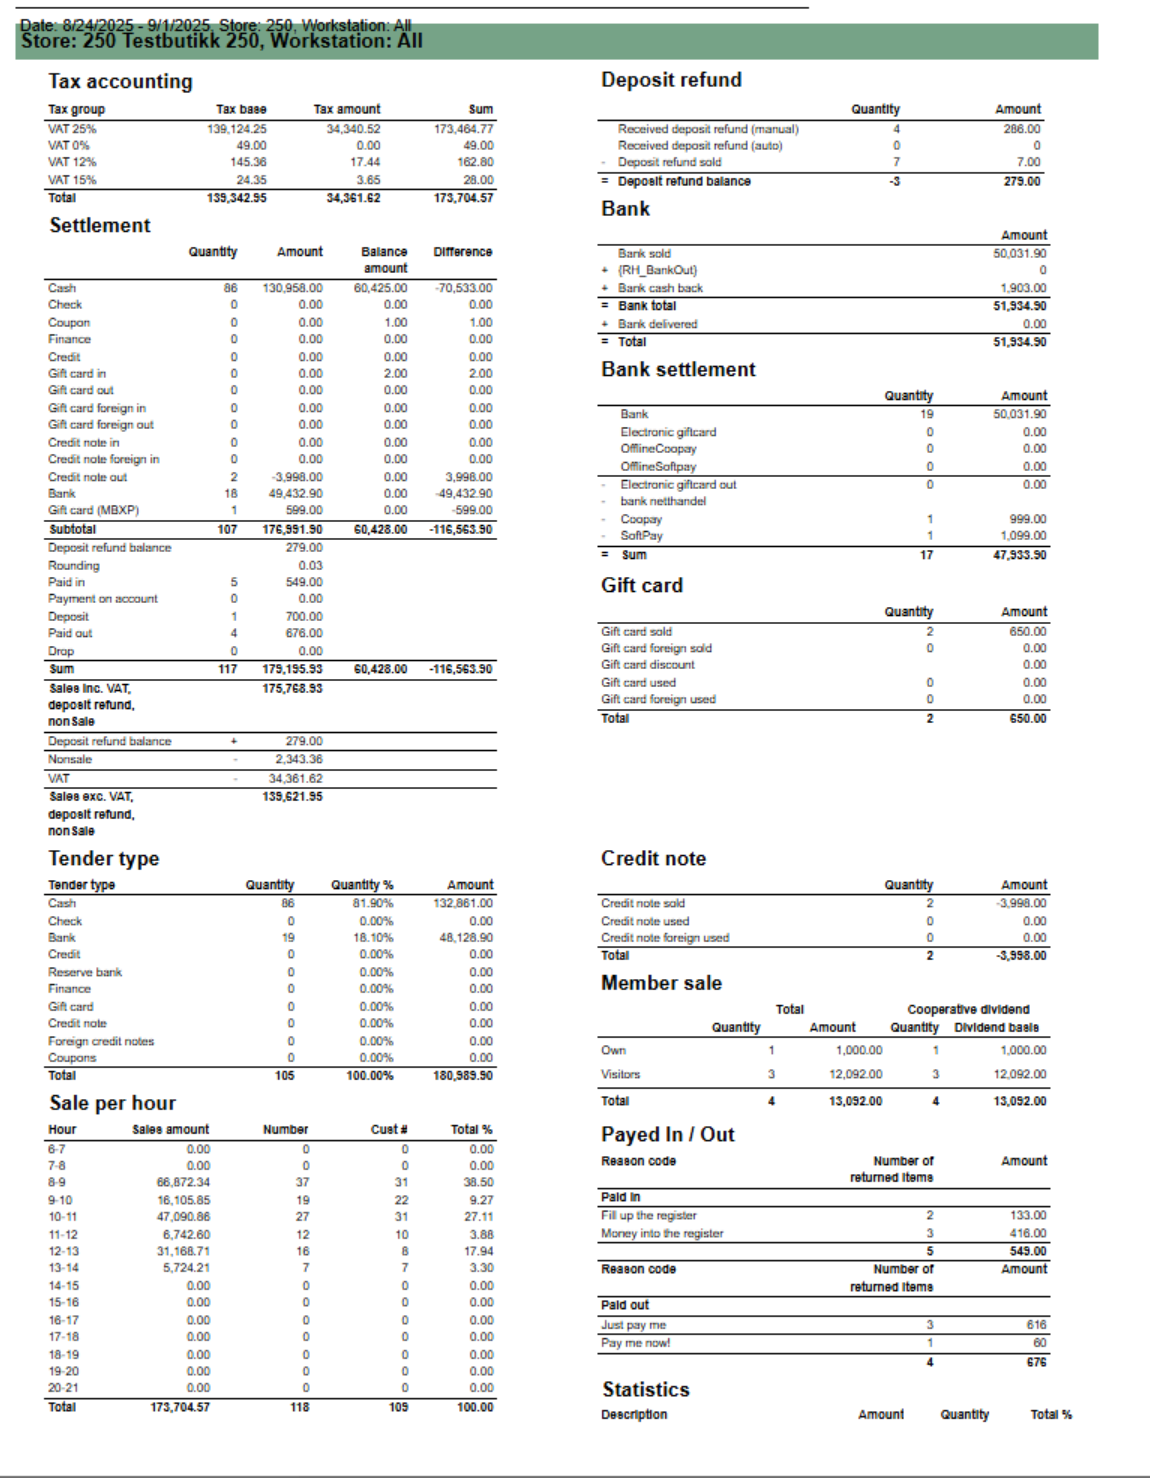 Image Added Image Added
Description: Report showing statistics per cashier in store. Because of performence report has single selct on store. Selections: - Date from - default today
- Date to - default today
- Profile - defalt all
- Team - default all
- Retail store - single selct, first available store selected
- Operator - defalt all for selected store
- Cashiers with no sale - default off. If on report will list all cashiers from store even if no sales
Hidden parameters: - pDeletedArticlesStatuses - Which deleted status will be included in row for Deleted items. Default: 2 - Deleted,12 - Deleted is last registered, 13 - Deleted is last remaining,14 - Deleted is last remaining and is last registered
- pDeletedOtherStatuses - Which deleted status will be included in row for Deleted other. Default: 7 - Deleted from on hold, 10 - Deleted in on hold from on hold, 15 - Deleted unfinished receipt, 16 - Deleted from unfinished receipt
- pDeletedReceiptStatuses - Which deleted status will be included in row for Deleted receipt. Default: 3 - Delted receipt
- pGeneralDiscount - Which discount types will be included in row for General discount. Default: 2 - Line discount, 3 - Group discount, 4 - Customer group discount, 5 - Adhoc package, 6 - Model discount, 7 - Member discount, 8 - Campaign discount, 9 - Giftcard discount, 10 - Personal discount, 11 - Subtotal discount
- pManualDepositRefundInArtGrp - Which item group will be included in row for Deposit refund manual. This will be calculated for all articles with articletype = depositrefund.
Output: Rows for data with one column for each operator. Rows: Store - Storename and numberCashier - Cashier name and numberNet amount - Net amount salesQuantity - Number of articles soldSale/cust - Average sale per customerItem/cust - Average items per customerTotal items open ex. PLU - Items sold without open priceTotal items open PLU - Items sold with open priceNullsale - Number of receipts finished with salesamount 0Total credit sales Amount - Amount sold on tendertype CreditTotal credit sales - Number of sales with tendertype CreditGiftcards out Amount - Amount of sold gift cards (sale with articletype giftcard)Giftcards out - Number of gift cards sold (sale with articletype giftcard)Returned items Amount - Amount of returned items (sales with direction in)Returned items - Quantity of returned items (sales lines with direction in)General discount Amount - Sum of discount for discount types set in parameter pGeneralDiscountGeneral discount - Quantity of items with discount types set in parameter pGeneralDiscountDeleted items Amount - Amount of deleted items with deleted status from parameter pDeletedArticlesStatusesDeleted items - Quantity of deleted items with deleted status from paramter pDeletedArticlesStatusesDeleted other Amount - Amount of deleted items with deleted status from parameter pDeletedOtherStatusesDeleted other - Quantity of delted items with deleted status from parameter pDeletedOtherStatusesDeleted receipt Amount - Amount of deleted receipts with deleted status from parameter pDeletedReceiptStatusesDeleted receipt - Quanity of deleted receipts with deleted status from parameter pDeletedReceiptStatusesDeposit - Number of deposit salesDifference - Difference between cash from balance and cash from tenderto follow up store settlement for all selected workstations / cash registers. Report is divided into 11 different sub reports wich will be described separatly below. Selections (applies to all sub reports) - Date from: Default today
- Date to: Default today
- Retail store: Single selct, default first available store.
- Workstation: Default all for selected store
Source: - Lindbak POS Reporting cube (OLAP)
Parameters: - pAutomaticDepositRefundEans - List of EAN's used for automatic deposit refund
- pManualDepositRefundEans - List of EAN's used for manual deposit refund
Subreports: | Expand |
|---|
| title | 1023_subSettlement_3 |
|---|
| 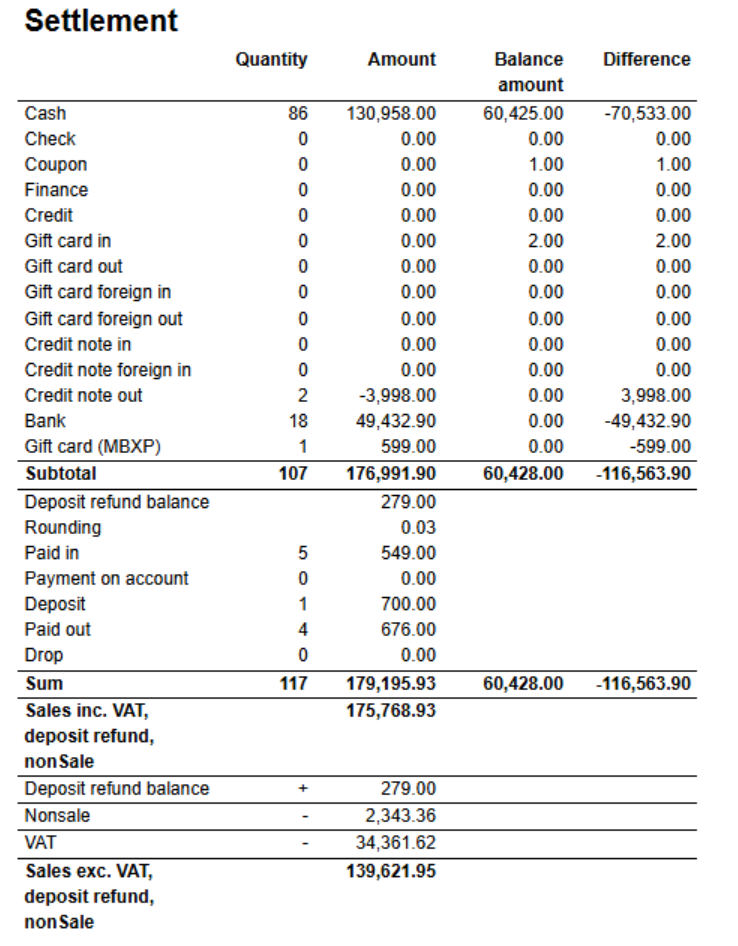 Image Added Image Added
Columns: - Quantity
- Amount
- Balance amount
- Difference
Rows: One row per tendertype with subtotal. - Cash
- Check
- Coupon
- Finance
- Credit
- Gift card in
- Gift card out
- Gift card foreign in
- Gift card foreign out
- Credit note in
- Credit note foreign in
- Credit not out
- Bank
- Gift card (MBXP)
One row for other transaction types with tender. With subtotal - Deposit refund balance
- Rounding
- Paid in
- Payment on account
- Paid out
- Drop
|
| Expand |
|---|
| title | 1024_subDepositRefund_2 |
|---|
| 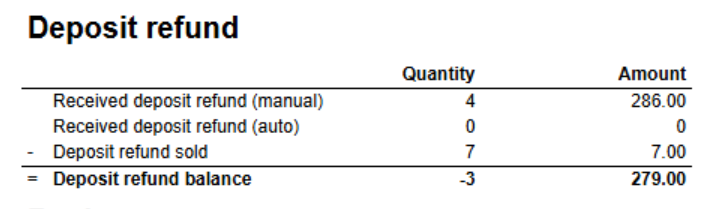 Image Added Image Added
Columns: Rows |
Received deposit refund (manual) Amount - Sum of sales with direction In from articles with article type = depositrefund where article is in articlegroup from parameter pManualDepositRefundInArtGrp- Received deposit refund (manual) -
|
Quantity of items with direction In from articles with article type = depositrefund where article is in articlegroup from parameter pManualDepositRefundInArtGrp- Deposit refund for list of ean's in parameter pManualDepositRefundEans (in main report)
- Received deposit refund (auto)
|
Amount Sum of sales with direction In from articles with article type = depositrefund where article is NOT in articlegroup from parameter pManualDepositRefundInArtGrpReceived deposit refund (auto) - Quantity of items with direction In from articles with article type = depositrefund where article is NOT in articlegroup from parameter pManualDepositRefundInArtGrpSource: Lindbak POS Reporting Cube (Olap) |
...
RTC-47005
Image Removed
Description:
Report for comparing basic sales between two stores with date selection for each store.
Selections:
- Date from - Start date for reference store. Default today
- Date to - End date for reference store. Default today
- Compare date from - Start date for comparing store. Default today
- Compare date to - End date for comparing store. Default today
- Retail store ref - Reference store. Default all
- Retail store comp - Comparing store. Default all
- Department - default all
- Article area - default all
- Article group - default all
- Article subgroup - default all
- Statistic - Which level of hierarcy to run report for. Department, Area, Group, SubGroup and Item. Default Department.
Output:
One row for each level of selected hierarchy. Totals for all level of hierarchy above selected. Hierarchy above selected is colored dark grey.
Columns:
- Item
- Number and name of hierarchy.
- Reference store with date selections.
- Sales ex/VAT - Sales excluding VAT
- Gr.prof. - Gross profit
- Gr.prof. % - Gross profit in percentage
- Comparing store with date selections
- Sales ex/VAT - Sales excluding VAT
- Gr.prof. - Gross profit
- Gr.prof. % - Gross profit in percentage
- Difference
- Sales ex/VAT - Difference between reference store and comparing store
- Gr.prof. - Difference between reference store and comparing store
- Gr.prof. % - Difference between reference store and comparing store
Source:
Lindbak POS Reporting Cube (Olap)
- Deposit refund for list of ean's in parameter pAutomaticDepositRefundEans(in main report)
- Deposit refund sold - Sold deposit refund (article type)
- Deposit refund balance = Received - sold
|
| Expand |
|---|
| 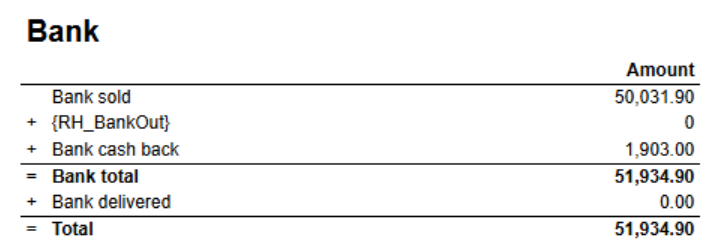 Image Added Image Added
Columns Rows - Bank sold
- Bank out
- Bank cash back
- Total = sold + out + cash back
|
| Expand |
|---|
| title | 1026_subBankSettlement_2 |
|---|
| 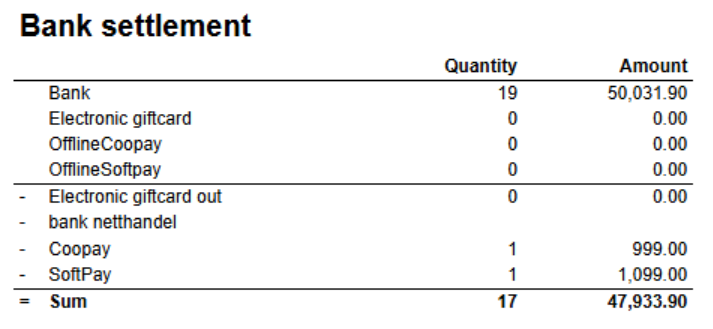 Image Added Image Added
Columns: Rows - Bank - Sold bank
- Electronic giftcard
- Offline Cooppay - Offline transactions with Cooppay
- Offline Softpay - Offline transactions with SoftPay
- Electronic giftcard out
- bank netthandel -
- Cooppay
- SoftPay
|
| Expand |
|---|
| title | 1027_subMemberSale_2 |
|---|
| 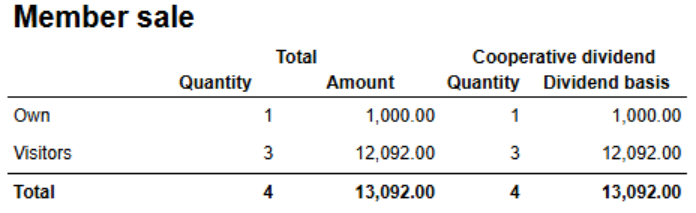 Image Added Image Added
Columns Rows - Own - Sale for members in own cooperative
- Visitors - Sale for members in other cooperatives.
|
| Expand |
|---|
| title | 1028_subPayedInOutReasonCodes |
|---|
| 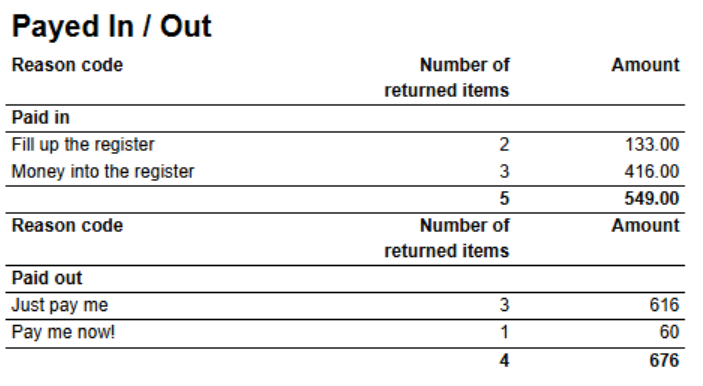 Image Added Image Added
Columns Rows - Paid in. One row for each Paid in reason code.
- Paid out. One row for each Paid out reason code.
|
| Expand |
|---|
| 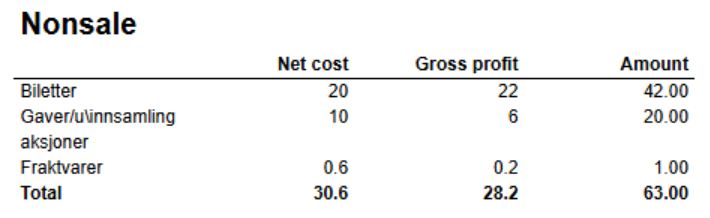 Image Added Image Added
Columns - Net cost
- Gross profit
- Amont
Rows - One row for each nonsale type. With total
|
| Expand |
|---|
| title | 1030_subPriceChannel |
|---|
| 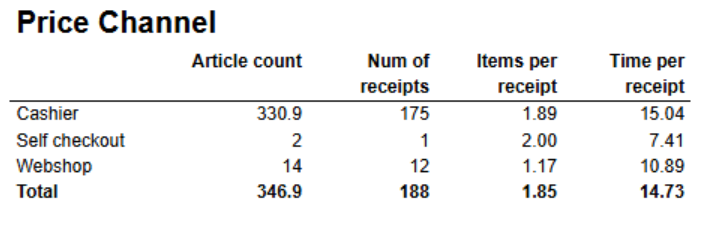 Image Added Image Added
Columns - Article count
- Num of receipts
- Items per receipt
- Time per receipt - Difference between startdatetime and enddatetime.
Rows - One row for each price channel.
|
| Expand |
|---|
| title | 1032_subSalePerHour_2 |
|---|
| 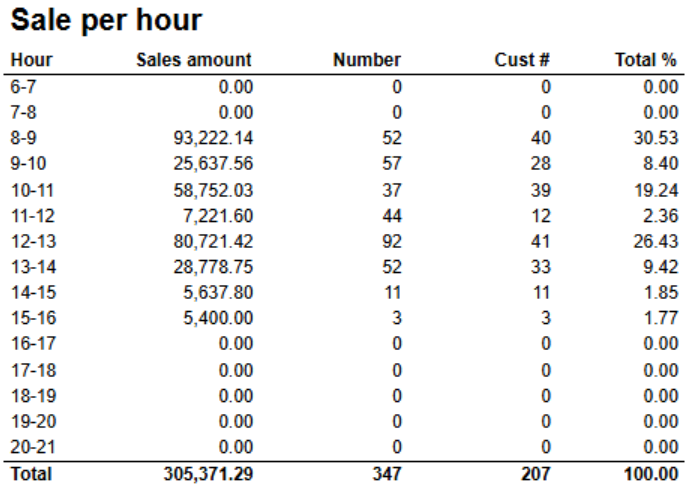 Image Added Image Added
Columns - Hour
- Sales amount
- Number - Number of items
- Cust # - Number of customers
- Total % - Share
Rows - One row for each hour set in parameter pHourFrom and pHourTo
Parameters - pHourFrom - Report will show hours between pHourFrom and pHourTo (starting hour)
- pHourTo - Report will show hours between pHourFrom and pHourTo (starting hour)
|
| Expand |
|---|
| title | 1031_subStatistics_2 |
|---|
| 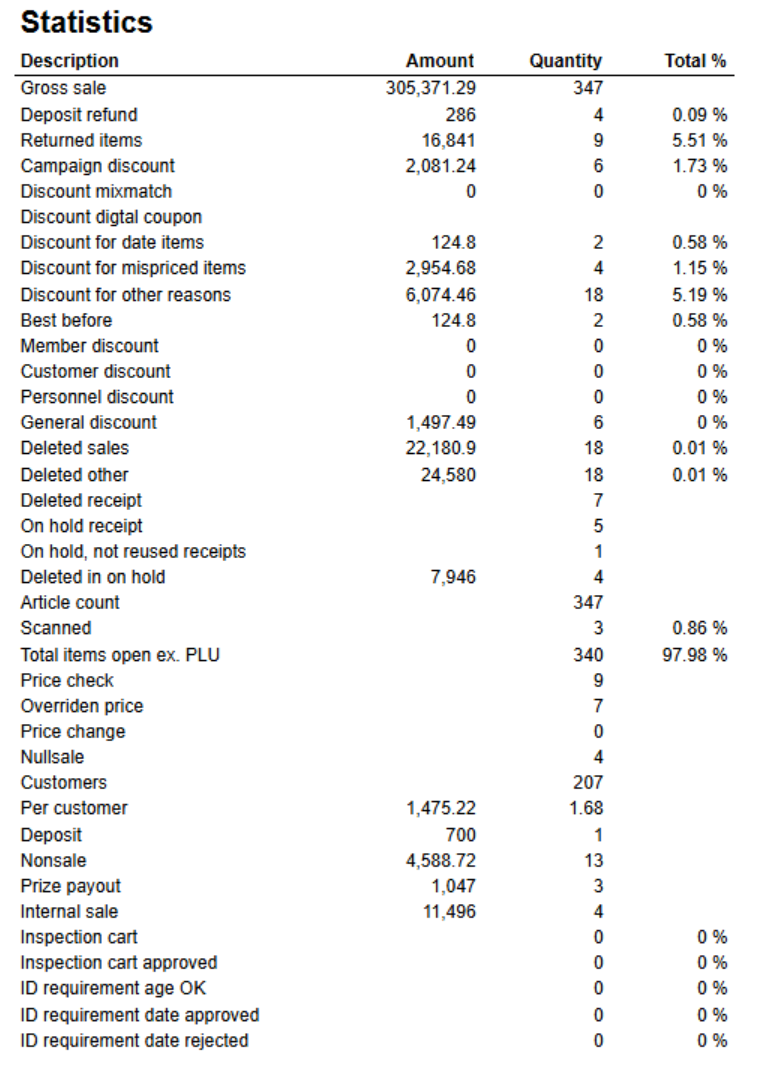 Image Added Image Added
Columns Rows - Gross sale
- Deposit refund
- Returned items
- Campaign discount
- Discount mixmatch
- Discount digital coupon
- Discount for date items
- Discount for mispriced items
- Discount for other reasons
- Best before
- Member discount
- Customer discount
- Personell discount
- General discount
- Deleted sales
- Deleted other
- Deleted receipt
- On hold receipt
- On hold, not reused receipts
- Deleted in on hold
- Article count
- Scanned
- Total items open ex. PLU
- Price check
- Overridden price
- Price change
- Nullsale
- Customers
- Per customer
- Deposit
- Nonsale
- Prize payout
- Internal sales
- Ispection cart
- Inspection cart approved
- ID requirement age OK
- ID requirement date approved
- ID requirement date rejected
|
|
...
| Expand |
|---|
| title | 4007_ShortCashierReport |
|---|
|
RTC-47013 Image Removed Description: Report giving information about revenue payment methods and settlement for cashiers Selections: - Date from - default today
- Date to - default today
- Team - default all
- Profile - default all
- Retail store - default all
- Operator - default all for selected store(s)
Output: Grouped by store with one row for each cashier. Columns: - Cashier - <storenum>-<cashiernum>
- First name - First name of cashier
- Last name - Last name of cashier
- Registered revenue - Sales amount including VAT
- Bank card - Tender used with bank card (CreditDebit)
- Credit - Tender used with Credit
- Paid in - Controltransaction with Paid in
- Drop / paid out - Controltransactions with Drop and paid out
- Other payment methods - Tender with tender types not mentioned above or below.
- Received cash/check - Tender used with Cash and Check
- Cash settlement - Balance transaction with tender type Cash and Check
- Difference - Difference between Cash Settlement and Received cash/check
Source: Lindbak POS Reporting Cube (Olap) |
...
| Expand |
|---|
| title | 4008_CashRegisterReport |
|---|
|
RTC-47014 Image Removed Description: Report giving information about revenue payment methods and settlement for cash registers Selections: - Date from - default today
- Date to - default today
- Team - default all
- Profile - default all
- Retail store - default all
- Workstation - default all for selected store(s)
Output: Grouped by store with one row for each workstation. Columns: - Workstation - <storenum>-<workstationnum>
- Registered revenue - Sales amount including VAT
- Bank card - Tender used with bank card (CreditDebit)
- Credit - Tender used with Credit
- Paid in - Controltransaction with Paid in
- Drop / paid out - Controltransactions with Drop and paid out
- Other payment methods - Tender with tender types not mentioned above or below.
- Received cash/check - Tender used with Cash and Check
- Cash settlement - Balance transaction with tender type Cash and Check
- Difference - Difference between Cash Settlement and Received cash/check
Source: Lindbak POS Reporting Cube (Olap)
|
| Anchor |
|---|
| 8000_InvoiceAging |
|---|
| 8000_InvoiceAging |
|---|
|
...