Versions Compared

Key

  • This line was added.
  • This line was removed.
  • Formatting was changed.

...

Anchor
0022_SalesPerCustomer
Anchor
0022_SalesPerCustomer_2

Expand
title0022_SalesPerCustomer

Description:

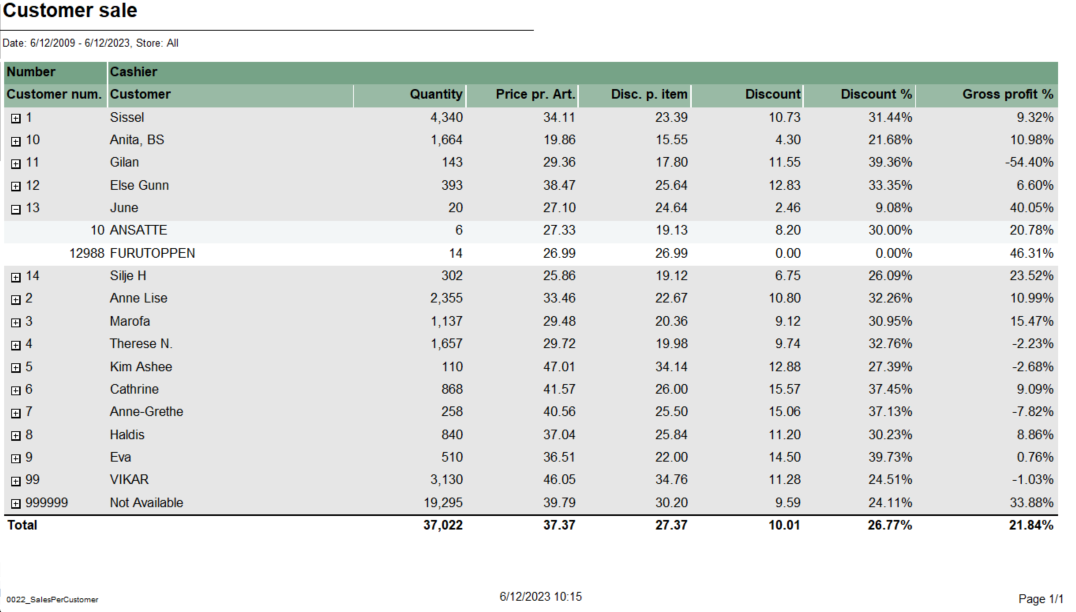
Report lists sales per customer.

Selections:

  • Date from - Default today
  • Date to - Default today
  • Store - Default all

Output:

  • Summary totals at the end of new hierarchy level for cashier.
  • Report has a total summary at the end of table for all cashiers.

Columns:

Customer number

Number - Operator number

Cashier - Cashier name

Customer - Customer name

Quantity

Price pr. Art. - Price per article

Disc. p. item - Discount per item

Discount

Discount % - Discount percentage

Gross profit % - Gross profit percentage

Hidden parametes:

  • pCustomer - parameter takes selected customers and shows sales for them ( it expects existing customers; version _2 removes leading '0's from CW passed parameters)

Source:

  • Lindbak POS Reporting Cube (OLAP)


...

Expand
title0602_ArticleGroupSales

Description:

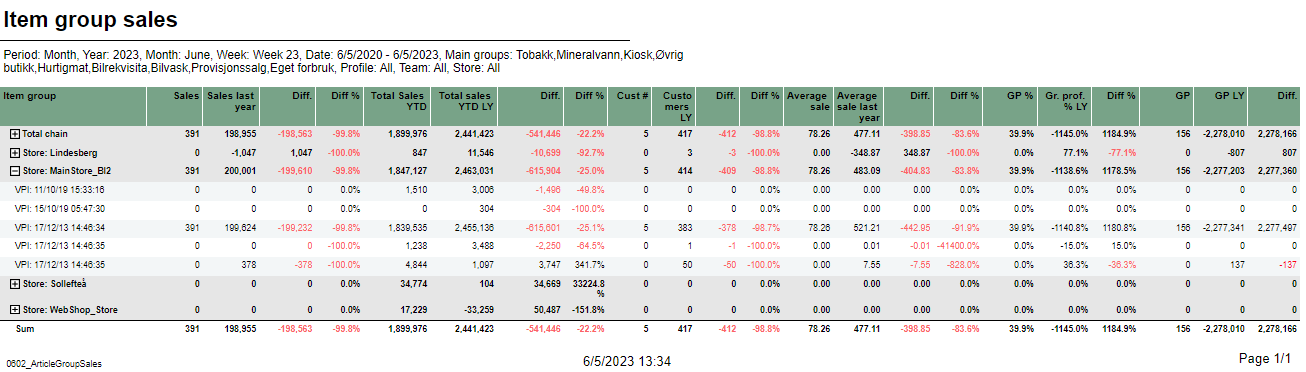
Report lists item group sales with drilldown for selected stores

Selections:

  • Periode – default month (it will decide if we use Year, Month, Week or Date parameters to choose selected and reference time scope) 
  • Year – Default current year
  • Month – Default current month
  • Week – Default current week
  • Date from – Default today
  • Date to – Default today
  • Maingroup – Default all
  • Profile – Default all
  • Team – Default all
  • Store – Default all

Output:

  • One page per store. Report has a summary on each column.
  • Summary totals in the beginning  of new hierarchy level for store.

Columns:

  • Item group
  • Sales – sales net amount
  • Sales last year – Sales net amount last year
  • Diff. – Difference for sales, total sales, customers, average sales and gross profit
  • Diff. % - Difference percentage
  • Total sales YTD – Total sales year to date
  • Total sales YTD LY – Total sales year ro date last year
  • Cust # - Number of customers
  • Customers LY – Customers last year
  • Average sale
  • Average sale last year
  • GP % - Gross profit percentage
  • Gr. prof. % LY – Gross profit percentage last year
  • GP – Gross profit
  • GP LY – Gross profit last year

Clarifications:

Negative values are colored red.

Use pPeriod=Date for subscriptions with dynamic periods in chain web to use dynamic dateFrom dateTo. 

Source:

  • Lindbak POS Reporting DW
  • Lindbak POS Reporting Cube (OLAP)


...

Expand
title0759_SalesAnalysisWithComparisonAndDrilldown

CO-211507 / RTC-45144

Updated: 

Image Added

Description:

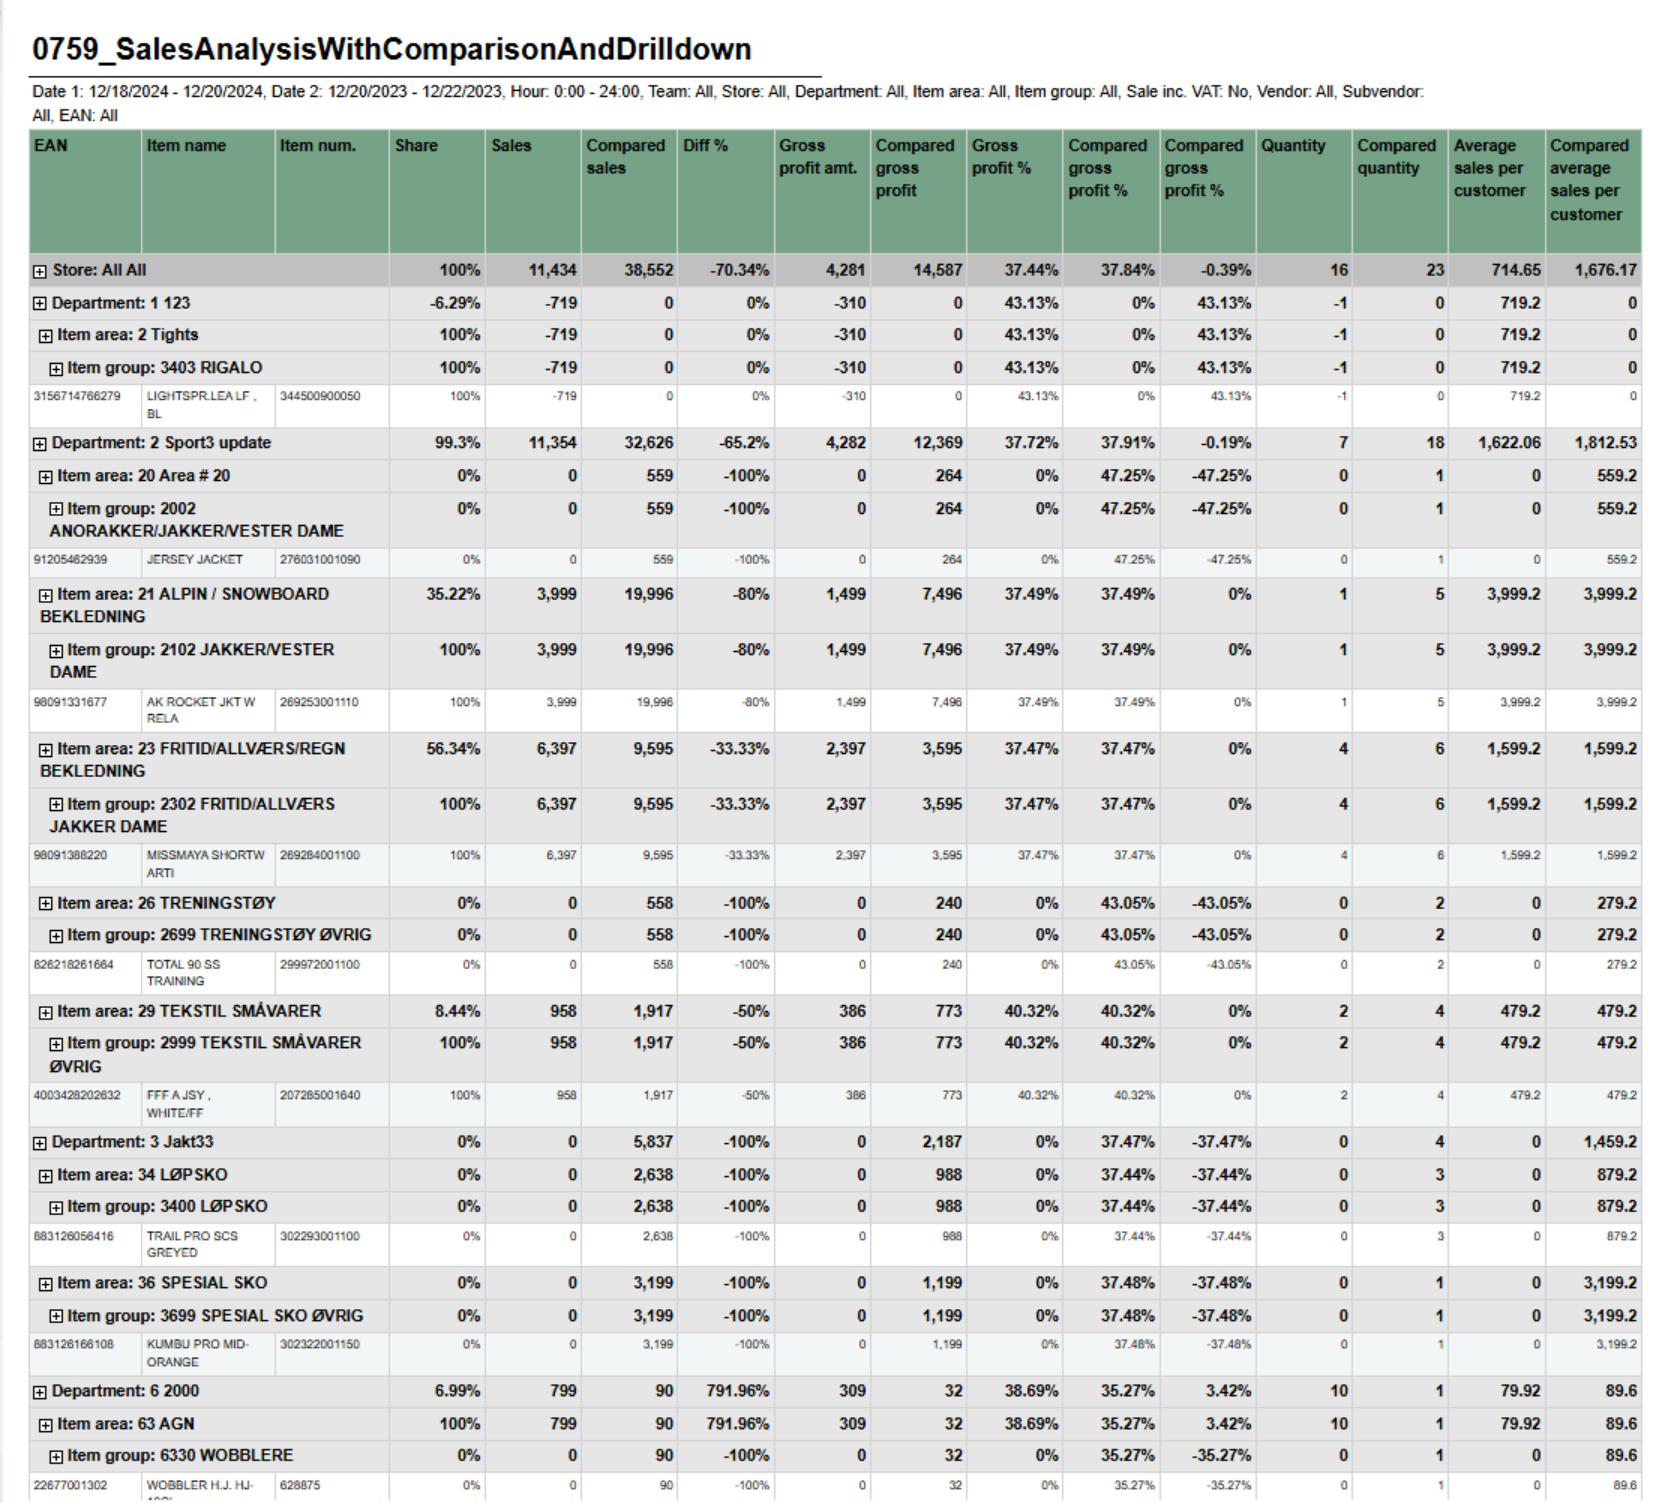
Report shows sales statistics in a hierarchy from store to department, item area, item group and item. Report show statistics for all selected stores and a total page for all selected store.


Selections:


  • Date from – Default today
  • Date to – Default today
  • Compare date from – Default last year from today
  • Compare dat to – Default last year from today
  • Hour from – Default 0:00
  • Hour to – Default 24:00
  • Team – Default all
  • Stores – Default all
  • Department – Default all
  • Article area – Default all
  • Article group – Default all
  • Vendor – Default all
  • Subvendor – Default all
  • EAN list  - Default empty
  • Include VAT – Default false
  • Exclude groups  - Default false
  • Excluded groups – Default groups 2 and 92.  Appears when Exclude groups is switched to true

Output:

One line per item with the hierarchy from store, department, item area and item group.


Columns:

  • EAN - Shows the entire hierchy down to EAN
  • Item name - Item name
  • Item num. - Item number
  • Share - Percentage share of sales
  • Sales - Sales amount
  • Compared ex. VAT – Compared sales excluding VAT
  • Diff % - Difference percentage between sales and compared sales
  • Gross profit amt. – Gross profit amount Compared gross profit
  • Gross profit % - Gross profit percentage
  • Compared gross profit % - Compared gross profit percentage
  • Diff gr. prof. %-units percentage points – Difference gross profit percentage in unitspercentage points
  • Quantity
  • Compared quantity
  • Diff % - Difference percentage between quantity and compared quantity
  • Average sales per customer inc. VAT – Average sales per customer including VAT
  • Compared average sales per customer inc. VAT – Compared average sales per customer including VAT


Hidden parameters:

  • pExcludedGroupsList – Report contain hidden parameter with selected article groups to be exluded by default. This parameter and pExcludedGroups will not work until parameter pExludeGroups will be set as True by user.


Source:

  • Lindbak POS Reporting Cube (OLAP)
  • Lindbak POS Reporting DW

...

Expand
title0783_DailyReportVat

Standard report

Description:

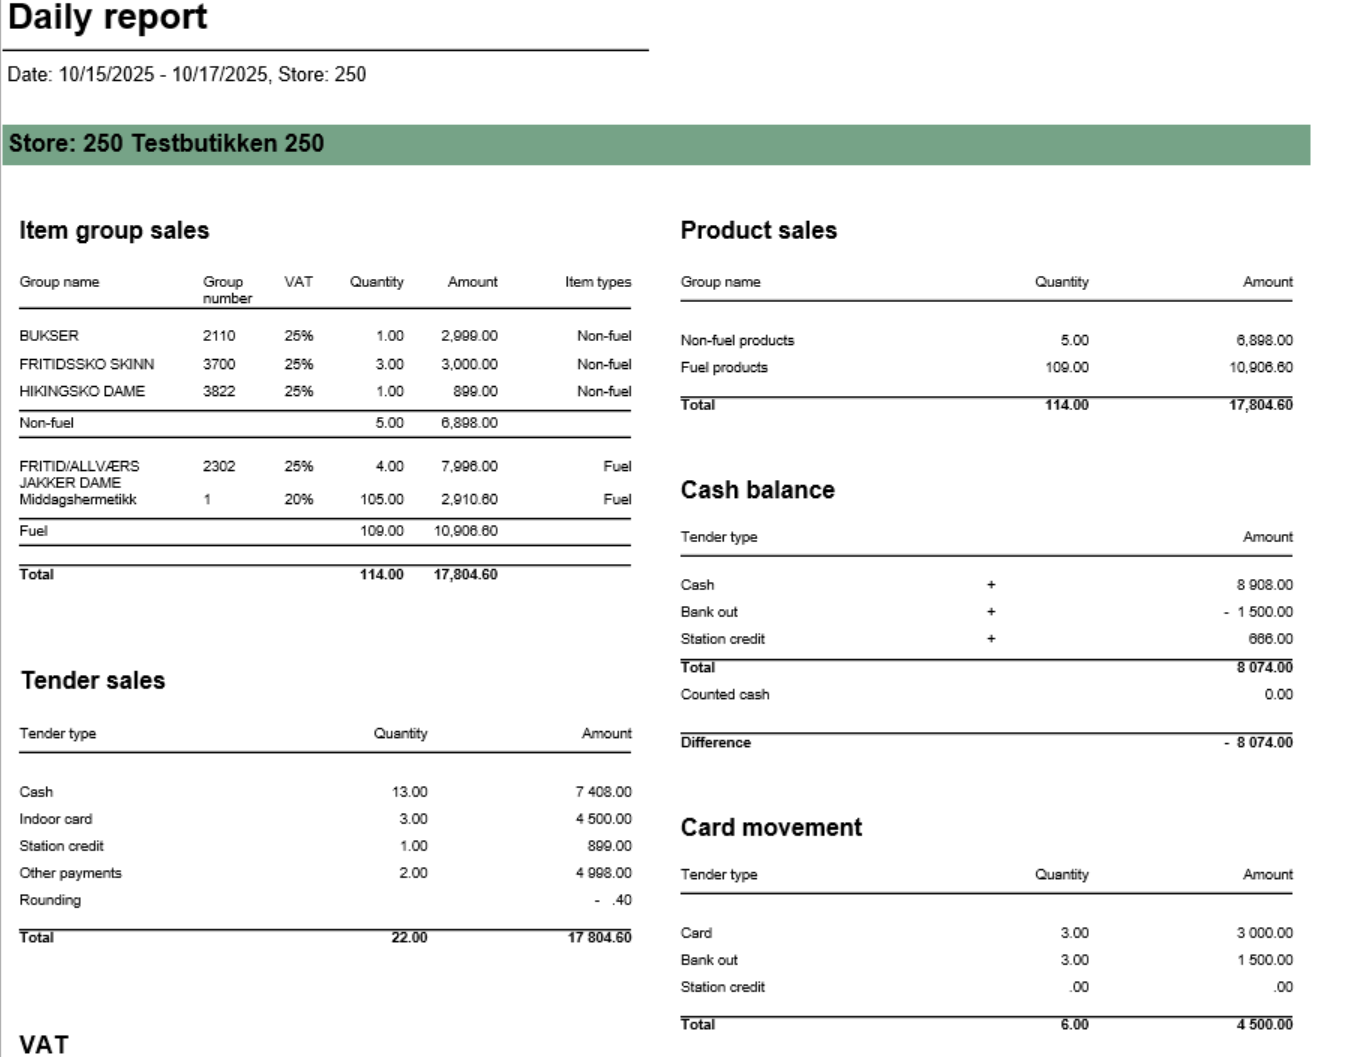
Report provides comprehensive daily settlement and sales statistics per store. Similar to 0780_DailyReport but with enhanced VAT breakdown. Report is divided into multiple sections showing product sales, tender types, cash reconciliation, card payments, and drive-off tracking.

Selections (applies to all sub reports):

  • Date from: Default yesterday
  • Date to: Default yesterday  
  • Retail store: Single value; default first available from the list

Hidden parameters:

  • pFuelItemType: Default \[Article\].\[Item Type\].&\[Fuel\] - Defines which item types qualify as fuel
  • pOtherPaymentCards: Default 30,31,32,33,34,35,36,37,38,39 - Payment card numbers for "other payments" section
  • pReasonCodeBreakage: Default \[Reason Code\].\[Reason Code\].&\[Avstikk\]&\[Return\] - Reason code for drive-off tracking
  • pPriceChannelOutdoor: Default \[Price Channel\].\[Price Channel\].&\[11\] - Price channel qualifying as outdoor sales

Source:

  • Lindbak POS Reporting Cube (OLAP) - All reports
  • Lindbak POS Reporting DW - 1812, Item Group Driveoff section only


Expand
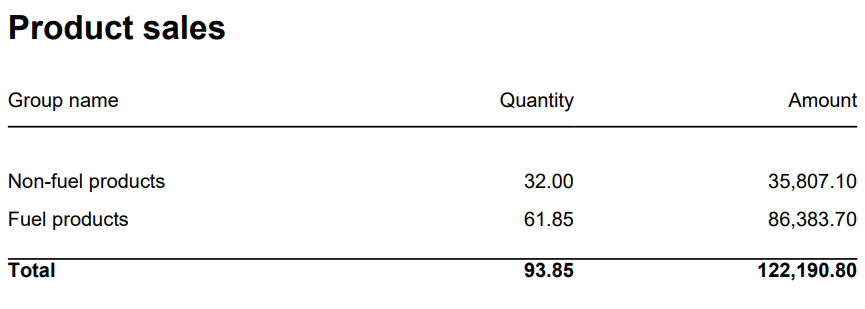
title1802_subProductSales

Columns:

  • Item Group Name
  • Item Group Number
  • Quantity
  • Amount

Rows:

  • Subtotal Fuel
  • Subtotal Non Fuel

______________________________________________________________________________________

  • Total


Expand
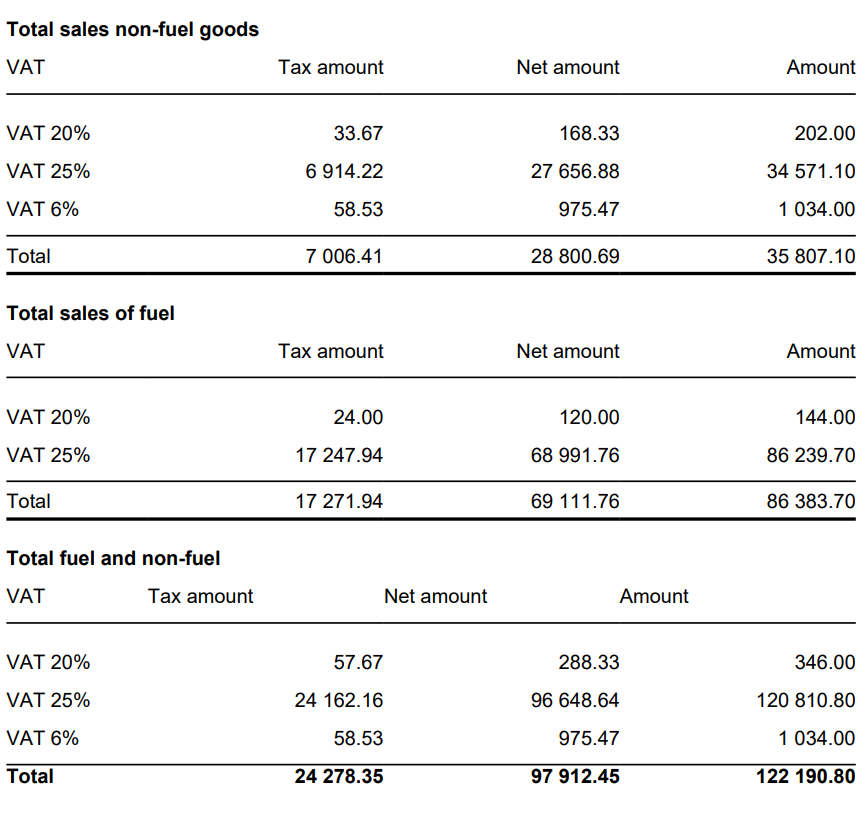
title1804_subVAT

Columns:

  • VAT
  • Tax Amount
  • Net Amount
  • Amount

Rows:

  • One row per VAT with divide to fuel and non fuel.
  • Subtotal: Total for all rows above Subtotal

______________________________________________________________________________________

  • One row per VAT
  • Total 
Expand
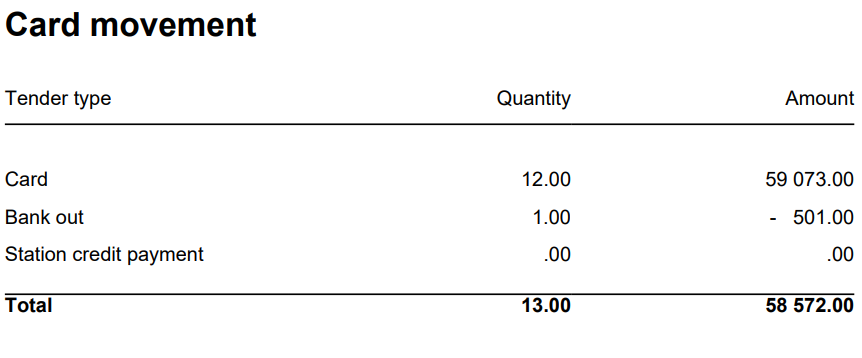
title1805_subCardMovement

Columns: 

  • Tender Type
  • Quantity
  • Amount

Rows:

  • Card
  • Cashback

  • Station Credit Payment
  • In Payment

_____________________________________________________________________________________

  • Total
Expand
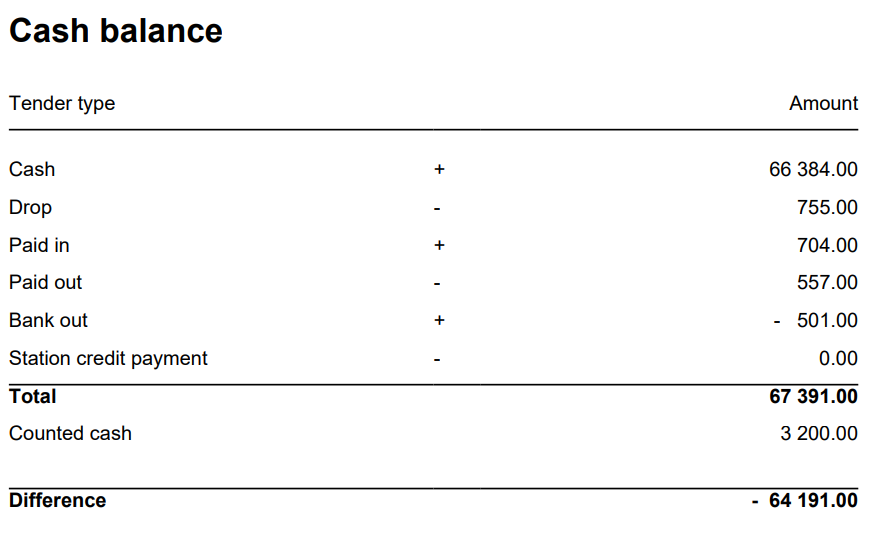
title1806_subCashBalance

Columns: 

  • Tender Type
  • Quantity
  • Amount

Rows:

  • Cash = TenderAmount for TenderType.Cash - ControlAmount for TenderControlType.PayedIn + ControlAmount for TenderControlType.PayedOut
  • Drop = ControlAmount for TenderControlType.Drop
  • Paid In = ControlAmount for TenderControlType.PayedIn
  • Paid Out = ControlAmount for TenderControlType.PayedOut
  • Cashback = TenderAmount for TenderType.CashBack
  • Station Credit Payment = TenderAmount for TenderControlType.Cash and TenderControlType.PaymentOnAccount

_____________________________________________________________________________________

  • Total (Cash - Cashback - Drop + Paid In + Paid Out(negative) - Station Credit Payment)
    = TenderAmount for TenderType.Cash - This is sum of all cash sales from tender except controltransactions.
    - ControlAmount for TenderControlType.Drop - Sum of all cash sales from tender with controltransaction Drop
    + ControlAmount for TenderControlType.PayedIn - Sum of all cash sales from tender with controltransaction PayedIn
    - ControlAmount for TenderControlType.PayedOut - Sum of all cash sales from tender with control transaction PayedOut
    + TenderAmount for TenderType.CashBack (negative value)
    - TenderAmount for TenderControlType.Cash and TenderControlType.PaymentOnAccount
  • Balance Amount Cash = BalanceAmount for TenderType.Cash

_____________________________________________________________________________________

  • Difference (Balance Amount Cash - Total)
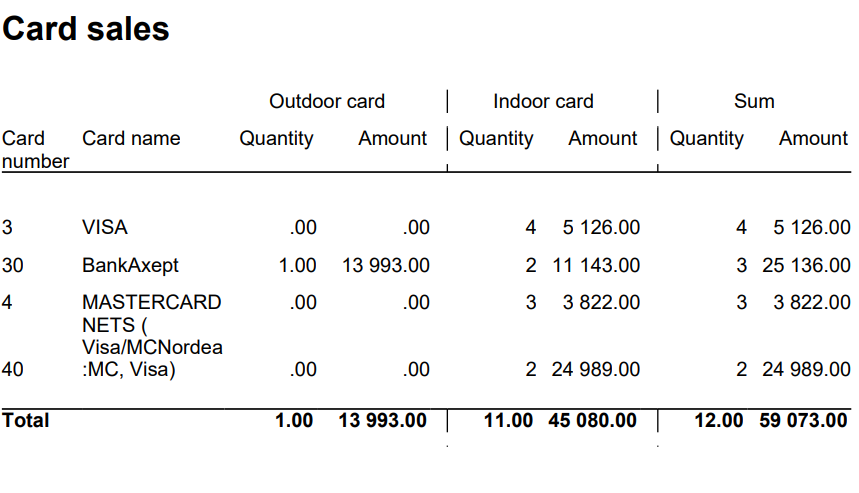
Expand
title1807_subCardSales

Columns:

  • Card Number
  • Card Name
  • Quantity Outdoor
  • Amount Outdoor
  • Quantity Indoor
  • Amount Indoor
  • Quantity
  • Amount

Rows:

  • One row per Card

______________________________________________________________________________________

  • Total
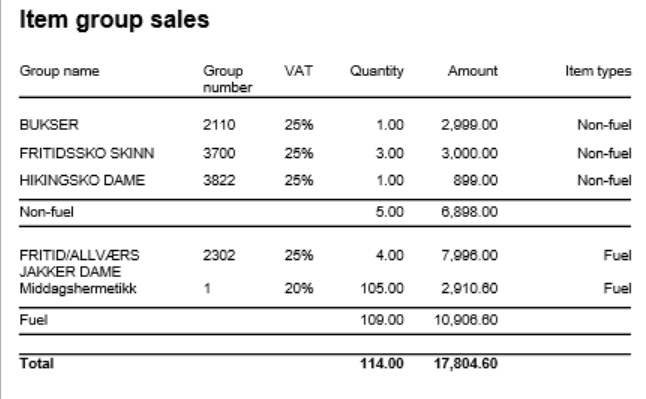
Expand
title1809_subItemGroupSalesVat

Columns:

  • Item Group Name
  • Item Group Number  
  • VAT: VAT percentage
  • Quantity: Sold quantity
  • Amount: Sales amount inc. VAT
  • Type: Fuel or Non-Fuel classification

Grouping:

  • Data grouped by Fuel vs Non-Fuel products
  • Subtotals per fuel type
  • Grand total for all item groups
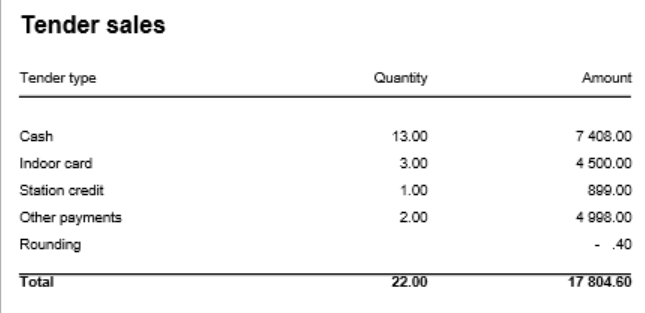
Expand
title1811_subTenderSales_2

Columns:

  • Tender Type
  • Quantity: Number of transactions
  • Amount: Tender amount

Rows:

  • Cash: Cash payments (excluding control transactions)
  • Outdoor Card: Card payments via outdoor price channel
  • Indoor Card: Card payments via indoor price channels  
  • Station Credit: Station credit payments
  • Other: Other tender types
  • Rounding: Subtotal rounding amount
  • Total: Sum of all tender types


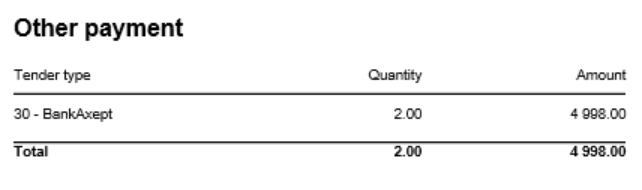
Expand
title1810_subTenderSalesOtherPayments

Columns:

  • Tender Type: Payment card number and name
  • Quantity: Number of transactions
  • Amount: Tender amount

Rows:

  • One row per payment card included in pOtherPaymentCards parameter (default: cards 30-39)
  • Total row
  • Rows with zero amount are hidden
Expand
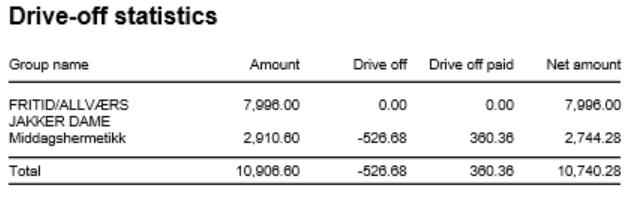
title1812_subItemGroupDriveoff

Columns:

  • Item Group Name: Article group name
  • Amount: Total sales amount inc. VAT
  • Drive Off: Breakage amount (negative transactions)
  • Drive Off Paid: Sold/paid amount (positive transactions)  
  • Net Amount: Grand total (Amount + Drive Off + Drive Off Paid)

Rows:

  • One row per article group
  • Total row
  • Entire section hidden if both totals are zero

Clarifications:

  • Uses reason code from pReasonCodeBreakage parameter to identify drive-off transactions
  • Drive Off column shows negative values from item transactions
  • Drive Off Paid shows positive values from item transactions
  • Only includes fuel item types specified in pFuelItemType parameter

Sorting:

  • No interactive sorting
  • Data sorted by natural hierarchy (Store, Article Group, etc.)
h4. Source:
* Lindbak POS Reporting Cube (OLAP
  • )
- All sections except Item Group Driveoff
* Lindbak POS Reporting DW - Item Group Driveoff section only

h4. Technical Notes:
* Report uses RSToolkit for language localization via User!Language
* Date parameters converted using Code.RSToolkit.ToTimeHierarchyString
* Multiple subreports with conditional visibility based on data availability
* Visibility logic: Rows/sections hidden when amounts are null or zero
* Report displays one page per selected store
* Footer displays "0780_DailyReport" (report name), page numbers, and current datetime


Anchor
0790_CashierStatistics

...

Expand
title0951_SecurityReport_DW

RTC-52380

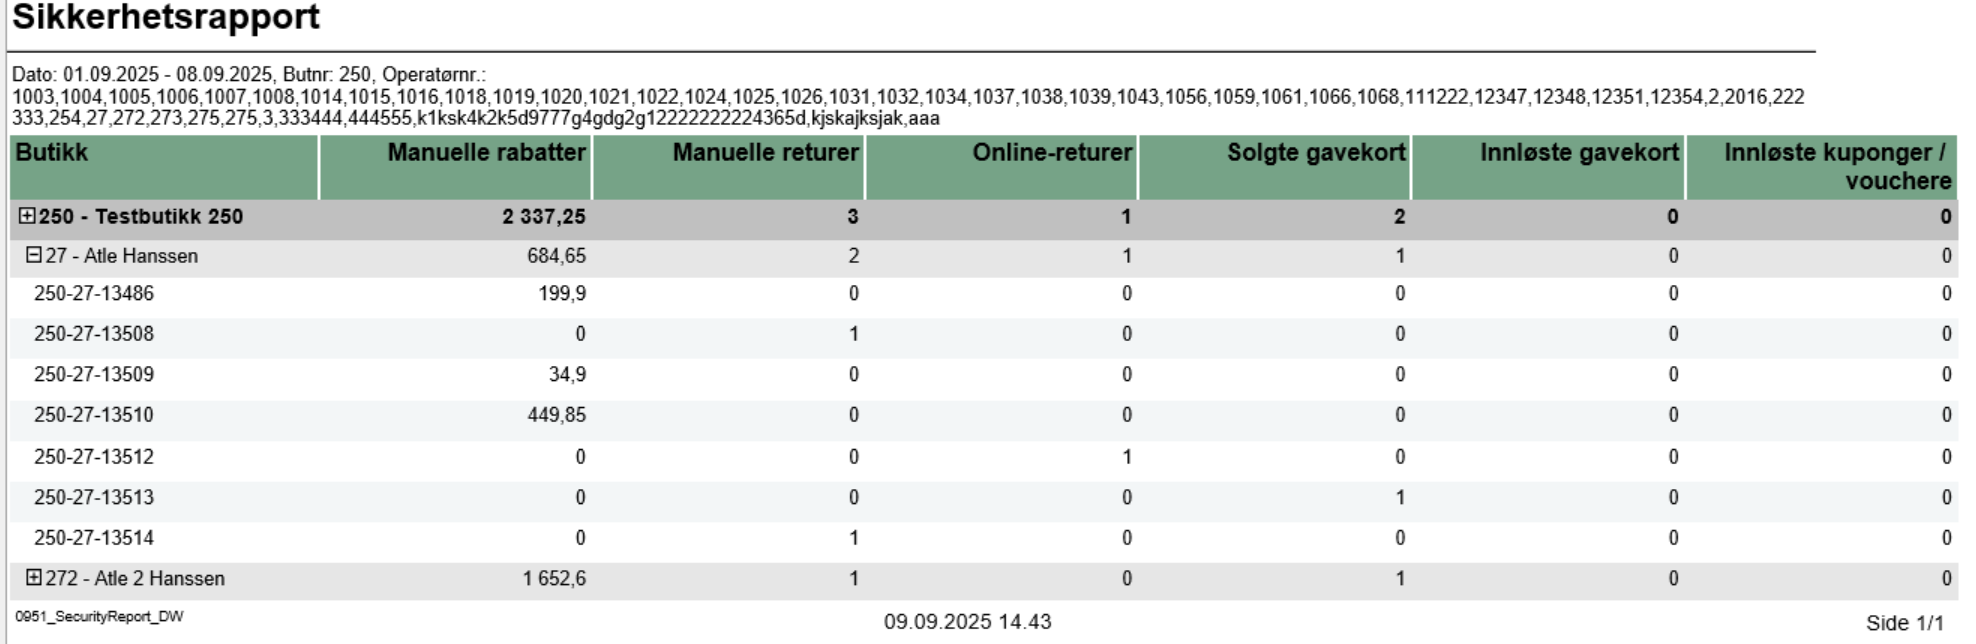
Description:

  • Report allows to monitor security-sensitive activities performed by cashiers/operators in the store, including manual discounts, returns, gift card transactions, and voucher usage.

Selections:

  • Date from: Default yesterday
  • Date to: Default yesterday
  • Retail store: Single select on store (because of performance). Default first available.
  • Operator: Default all operators for the selected store

Output:

Security activity statistics shown individually per each cashier security-relevant activities like manual discounts, returns, gift card sales/redemptions, and voucher usage with reference to receipt number.

Additionally there are totals for each operator and each store.

Columns:

  • Retail Store - Store identifier and name
  • Manual discounts - Sum of manual discount amounts (line and sub-total discounts)
  • Manual returns - Quantity of items returned without reference to original transaction
  • Online returns - Quantity of items returned with reference to original transaction
  • Giftcards out - Quantity of gift cards sold
  • Giftcards in - Count of gift card redemptions/usage
  • Voucher/coupon used - Count of voucher/coupon usage transactions

Sorting:

  • Retail Store (default)
  • Operator Display
  • Transaction ID

Source:

  • Lindbak POS Reporting DW - Data Warehouse database


Anchor
40000952_ItemSaleQuantityReportItemQuantityStores4000
0952_ItemSaleQuantityReportItemQuantityStores

Expand
title40000952_ItemSaleQuantityReportItemQuantityStores
RTC

RTP-

46626

43325

Image Removed

Image Added

Description:

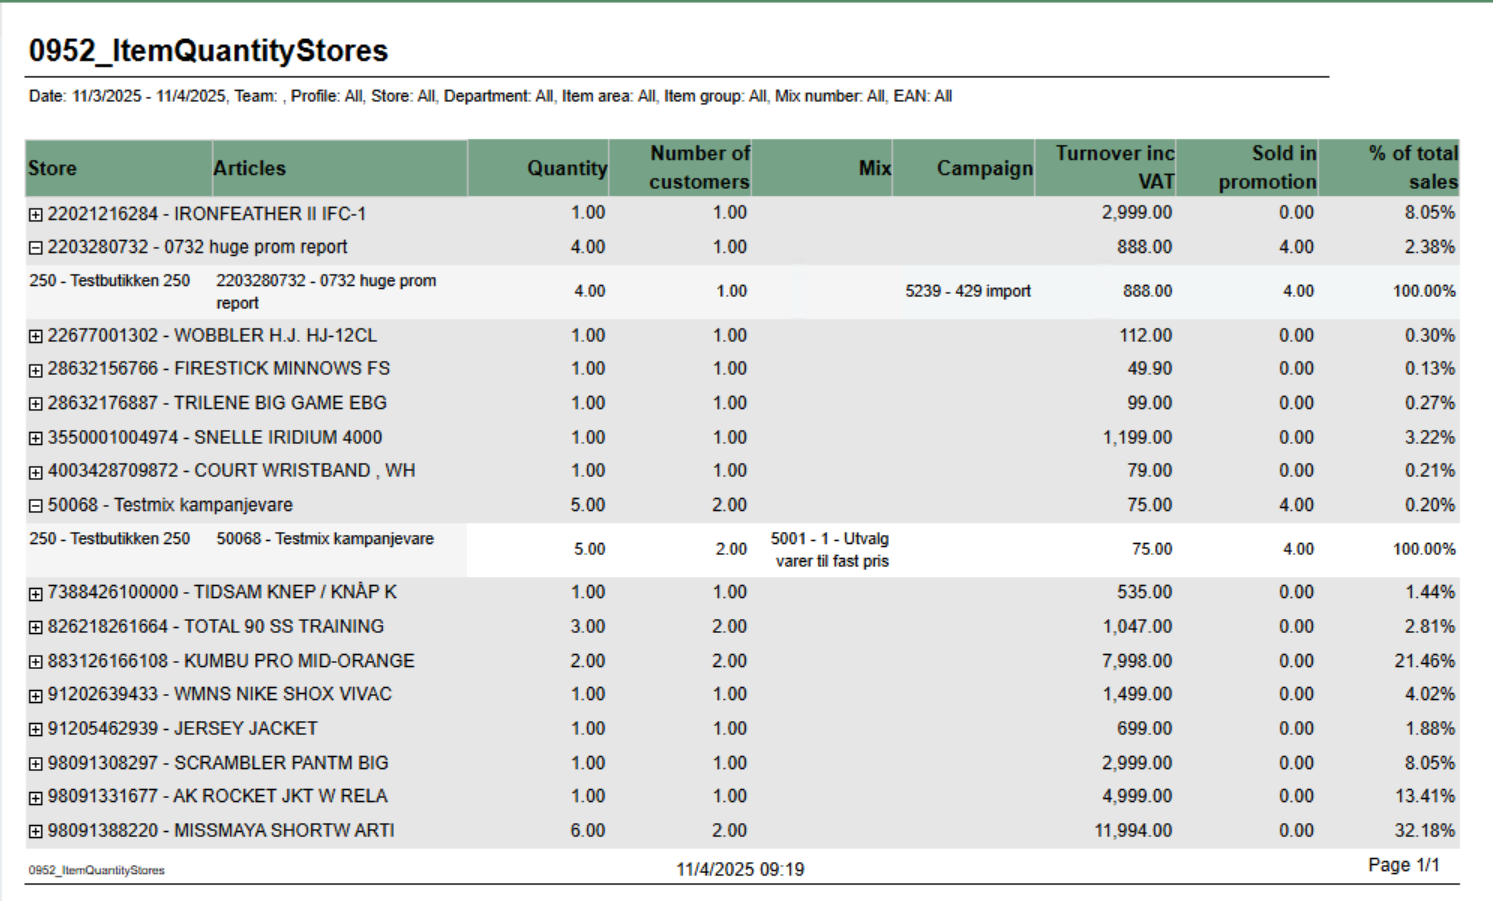
Report displays item quantity sales data aggregated by retail store with support for mix and campaign analysis. It provides detailed sales information including quantity sold, number of customers, turnover, and promotional sales breakdown. The report allows drill-down from article level to individual store performance.

Selections:

  • Date from: Default today
  • Date to: Default today
  • Team: Multivalue; default all
  • Profile: Multivalue; default all
  • Store: Multivalue; default all (filtered by Team selection)
  • Department: Multivalue; default all
  • Article area: Multivalue; default all
  • Article group: Multivalue; default all
  • Mix: Multivalue; default all
  • EAN list: Text input; default empty (comma-separated list of EAN codes)
  • Include VAT: Boolean; default true (toggles between amounts including/excluding VAT)
  • Expand all: Boolean; default false (when true, automatically expands all article groups to show store details)

Output:

Article sales statistics grouped by EAN with drill-down capability to individual store level. Report shows:

  • Summary row per article (EAN) with aggregated data across all stores
  • Detail rows per store showing individual store performance (visible when expanded)
  • Mix numbers and campaign information displayed as comma-separated lists when multiple values exist

Columns:

  • Retail Store: Article EAN and name (at summary level)
  • Articles: Article EAN and name (at detail level)
  • Quantity: Total quantity sold
  • Customers: Distinct receipt count (number of customers)
  • Mix: Mix numbers and names (comma-separated if multiple mixes apply to the article-store combination)
  • Campaigns: Campaign numbers and names (comma-separated if multiple campaigns apply)
  • Turnover: Total sales amount (with or without VAT based on Include VAT parameter)
  • Sold in Promotion: Quantity sold with discounts/campaigns (calculated as: Total Quantity - Quantity Not Discounted)
  • % of Total Sales: Percentage of article turnover compared to total report turnover

Sorting:

  • Primary: EAN (ascending)
  • Secondary: Retail Store Number (ascending)

Clarifications:

  • Quantity Not Discounted logic: Shows quantity only when Mix is 1, -1, or Unknown AND Campaign is Adhoc, NoCampaign, Not Available, or Unknown. Otherwise returns NULL.
  • Mix and Campaign Display: Uses LookupSet function to aggregate multiple mixes/campaigns per article-store combination with "|" delimiter for matching
  • Parameter Dependencies: Store parameter options are dynamically filtered based on Team selection

Source:

  • Lindbak POS Reporting Cube (OLAP)

Anchor
4000_ItemSaleQuantityReport

Expand
title4000_ItemSaleQuantityReport

RTC-46626

Image Added

Description:

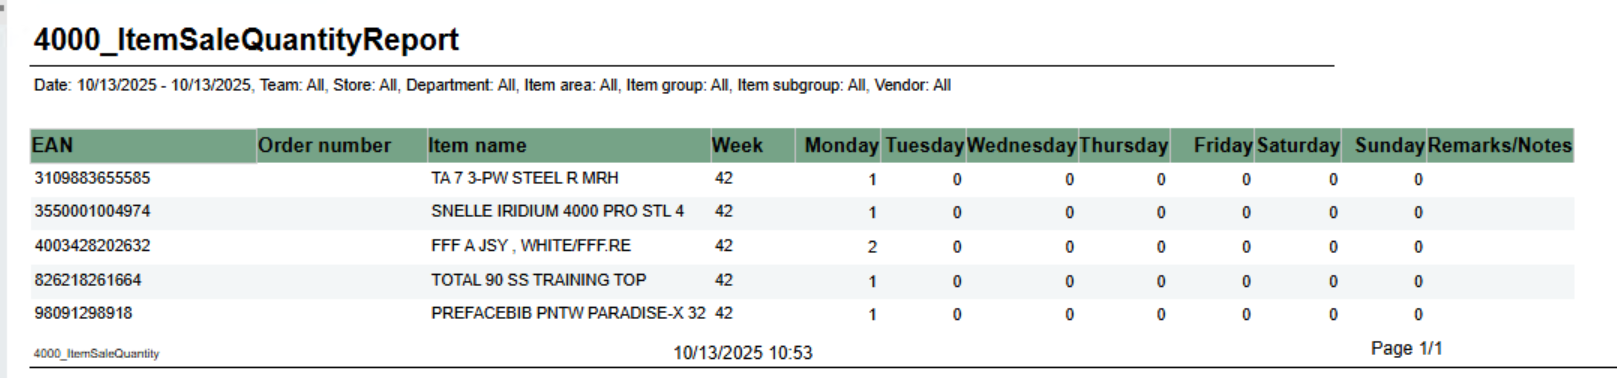
Report shows number of sold items per day of week. Grouped by week.

shows number of sold items per day of week. Grouped by week.

Selections:

  • From date - default first date of current week.
  • To date - default today
  • Team - default all
  • Retail store - default all
  • Department - default all
  • Article area - default all
  • Article group - default all
  • Article subgroup - default all
  • Vendor - default all

Note that is is possible to select default e.g article groups by selecting group(s) in parameter pArticleGroup

Output:

One row for ean item with columns for each day of week. In addition one column for notes.

Columns:

  • EAN - EAN
  • Item ID - Item number
  • Item name - Item name
  • Week - Week number
  • Monay - Friday - One column for each day
  • Remarks / Notes - Empty column.

Source:

Lindbak POS Reporting Cube (Olap)


...

Anchor
8013_CustomerSalesWithoutPrices
Anchor
8013_CustomerSalesWithoutPrices_2

Expand
title8013_CustomerSalesWithoutPrices

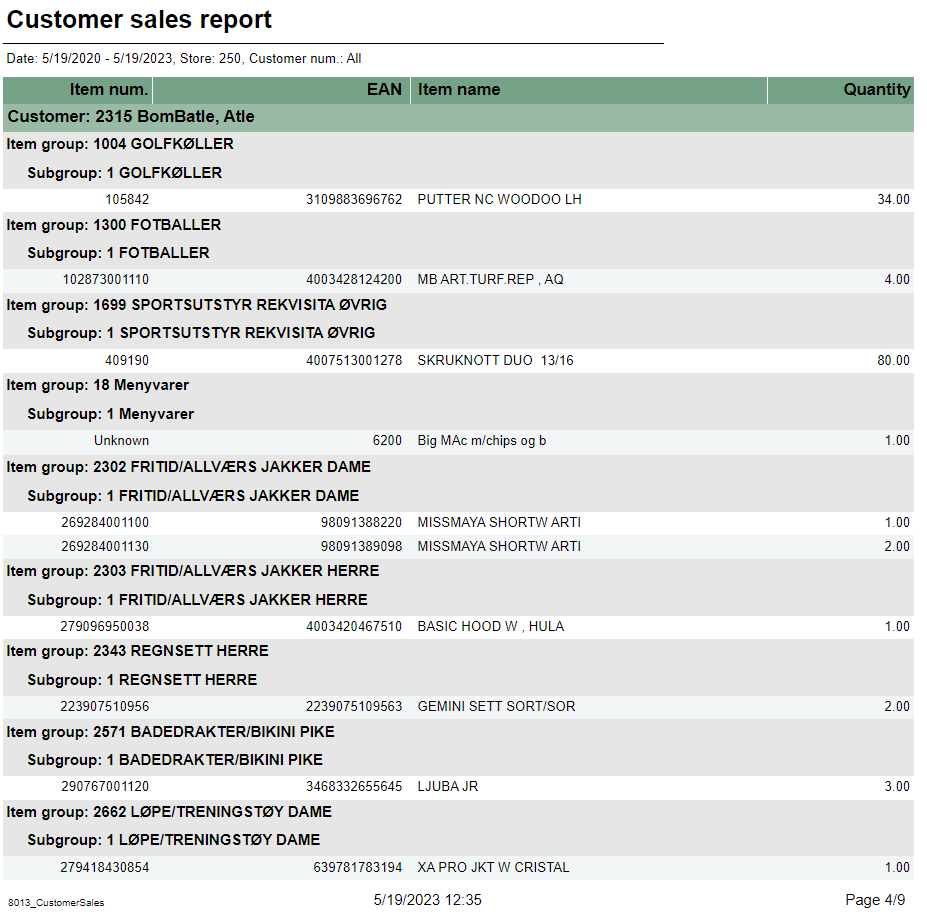
Description:

Report lists customer sales report without prices.

Selections:

  • Date from – Default today
  • Date to – Default today
  • Customer – Default all ( it expects existing customers; version _2 removes leading '0's from CW passed parameters)
  • Store – Default select a single store

Output:

Report shows table with customer sales period. For each customer, item groups and subgroup are shown.

Columns:

  • Item num. – Item number
  • EAN
  • Item name
  • Quantity

Source:

  • Lindbak POS Reporting Cube (OLAP)


...

Expand
title8600_InvoiceAgingDetailedMultipleStores

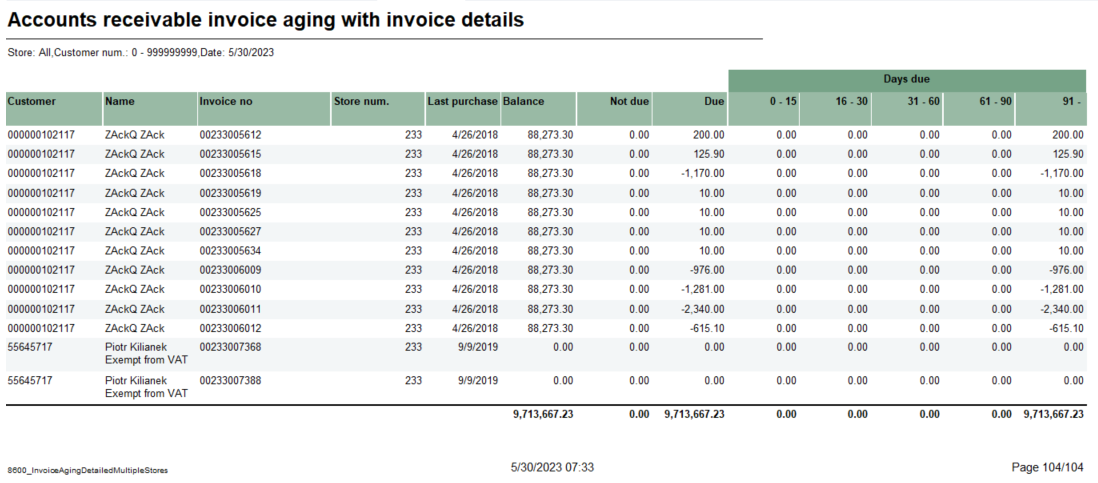
Description:

Report lists acciunts receivable invoice aging with invoice details.

Selections:

  • Date – Default today. Decides on slice of time allowing for checking state in the past. Limits to only invoices/payments that happened before that date.
  • Store – Default all
  • From customer – Default 0
  • To customer – Default 99999999

Output:

Reports shows invoice details for customers in stores. Report has a total summary at the end of table.

Columns:

  • Customer – Customer number
  • Name – Customer name
  • Invoice no – Inovice number
  • Store num. – Store number
  • Last purchase
  • Balance
  • Not due
  • Due
  • Days due:
    • 0-15
    • 16-30
    • 31-60
    • 61-90
    • 91-

Source:

  • Lindbak Retail
  • Lindbak POS Reporting Cube (OLAP)


...