Standard report
Description:
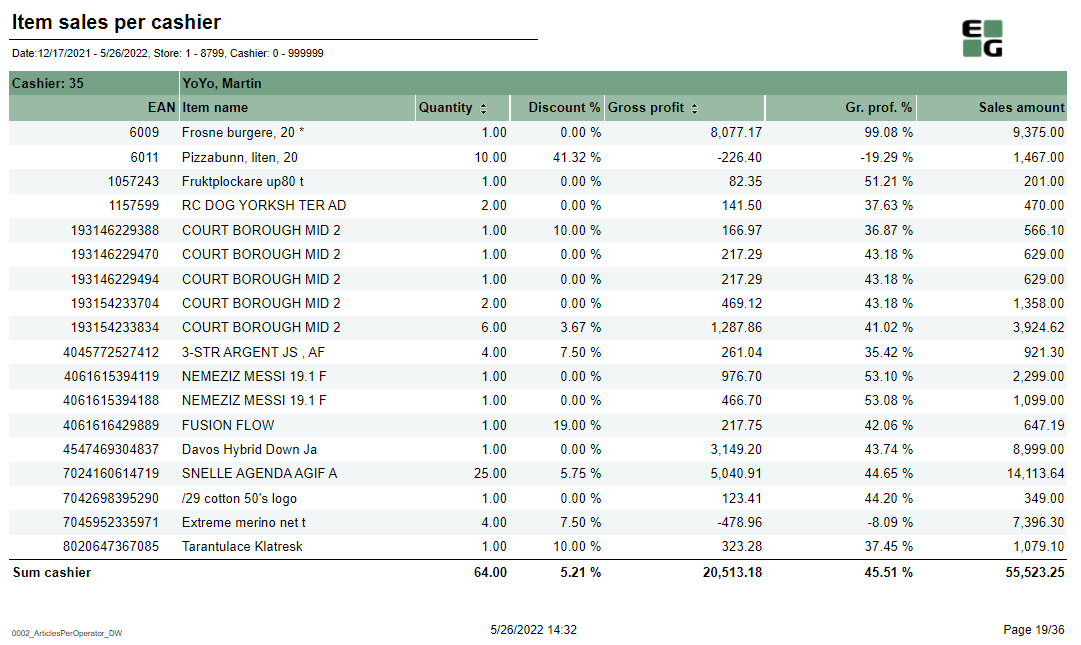
- Report allows to follow up cashiers sale performance.
Selections:
- Date from - Default today
- Date to - Default today
- Retail store from - Default 1
- Retail store to - Default 1
- Operator from - Default 0
- Operator to - Default 999999
Output:
Item sale statistics showed individually per each cashier (with number between Operator from and Operator to) per each stores (with number between Retail store from and Retail store to).
Additionally there are totals for each cashier and each store.
Columns:
- EAN
- Item name
- Quantity
- Discount % - Share of discount amount in original prize
- Gross profit
- Gross profit % - (gross profit)/(sales ex. VAT)
- Sales amount - sales inc. VAT
Sorting:
- EAN (default)
- Qunatity (interactive)
- Gross profit (interactive)
Source:
- Lindbak POS Reporting DW
CO attached to PBI #12200

Description:
- Report allows to check Nonsale quantity among stores and cashiers.
Selections:
- Date from - Default today
- Date to - Default today
- Retail store - Default all
- Operator - Default all
Output:
One row per item showing quantity of nonsale transaction on given item. Total per each cashier and per each store.
Columns:
- EAN
- Item name
- Quantity
Sorting:
- Store number
- Cashier number
Source:
- Lindbak POS Reporting cube (OLAP)
CO: 190338

Description:
Report allows to follow up bonus rollout checks usage and sales made using bonus checks.
Selections:
- Year from (default last year)
- Year to (default current year)
- Bonus rollout name (default all) - report shows data for available rollouts within selected period
- Loyalty program
Output:
Bonus checks usage and sales statistics grouped per store. Report lists all the stores in which checks were issued or redeemed.
Columns:
- Store - StoreNumber - Store name
- Number redeemed - Number of redeemed bonus checks issued in selected rollout(s)
- Sum redeemed - Sum of redeemed bonus checks
- Redeemed of total issued % - Share of redeemed bonus checks number for store compared to issued bonus checks number for all stores
- Average sale - Average sale inc. VAT made using bonus checks
Sorting:
- StoreNumber
Clarifications:
- Check is considered redeemed even if it was only partialy used
- Check is conntected to the store in which it was redeemed, not issued
Source:
- Lindbak POS Reporting cube (OLAP)
CO: 176619

Description:
Report shows all items which were not counted during inventory since given date.
Selection:
- Not counted since - Shows items that are not counted since this date. Default same date last month.
- Retail store - Only available for HQ users. Default first available store.
- Supplier - Filter result on supplier. Default all
- Item group - Filter result on item group. Default all
- Brand - Filter result on brand. Default all
- Show total only - If selected it will only show total, not any items. Default not selected.
Output:
All items which don't appear on last stocktaking. First row is total where under EAN there is a number of all items not counted.
Columns:
- Supplier - Supplier name
- EAN - EAN number
- Item number - Item number
- Item text - Item text
- Quntity - Last number in stock -Shows quantity from last stocktaking
- Net cost - Last Net cost - Shows total netcost for item from last stocktaking
Sorting:
- EAN
Source:
- Lindbak Retail database
CO: 156791. Based on report 0709.


Description:
Report allows to follow up store settlement: on first page settlement for all selected cashiers (if all cashiers are selected it equals whole store settlement) and settlement per each cashier on following pages. Report is divided in 9 subreports which will be descriped separatly below.
Selections:
- Date from - Default today
- Date to - Default today
- Store - Default all
- Operator -Default all
Subreports:
CO: 190620

Description:
Report allows to follow upcoming and ongoing campaigns and also browse expired campaigns.
Selections:
- Date from - Default today
- Date to - Default today
- Store - Default all
- Apply date filter to - Start date (Date from <= Start date <= Date to)/ End date (Date from <= End date <= Date to)/ Ongoing (Date from <= End date and Date to <= Start date) - default Start date
- Status - Expired/Active/Not approved - default all
- Include profile campaigns -default false
Output:
One row per campaign
Columns:
- Store
- Campaign group
- Campaign ID
- Campaign name
- Status - Expired/Active/Not approved
- Start date
- Start time
- End date
- End time
- Created by
Sorting:
- Interactive sorting on all columns except time
Source:
- dsProgress
CO: 191144


Description:
Report allows to follow up article sales and waste grouped per store and per (item group or item area).
Selections:
- Date from - Default today
- Date to - Default today
- Store - Default all
- Article area - Default all
- Article group - Default all
- Reason Code - Default all
- Grouping - item area or item group - Default Item area
- Exclude items without breakage - Default false
Output:
Article sales and waste statistics grouped per store and per item group or item area sorted by highest Lost amount. There is a page break per each store and total all stores in the bottom of last page. If Exclude items without breakage parameter is set to true there will be only items with breakage.
Columns:
- Buttons for expanding and collapsing all drilldowns.
- ItemNo - Item number
- Item name
- Sales quantity - number of sold items
- Sales ex. VAT - sales amount ex. VAT
- Net cost - net cost of sold items
- Waste qty - number of broken items
- Lost amount - net cost of broken items
- Breakage % - share of Waste qty in Sales quantity
- Lost amount % - share of Lost amount in Net cost
Sorting:
- On all levels (store, area, group and item): by Lost amount from highest to lowest.
Clarifications:
- If there are no sales on items with breakage, Breakage % and Lost amount % will be 100%
Source:
- Lindbak POS Reporting cube (OLAP)
Standard report


Description:
Report allows to follow up meber and member sale statistics divided by member age and member gender.
Selections:
- Date from - Default today
- Date to - Default today
- Retail store - Default all
- Loyalty program
Output:
Report is devided in 5 sections:
- Graph and table showing number of members who joined in the selected date range, compared to the number of members who joined the year before.
- Sales statistics divided between members and not member customers
- Graph and table showing sales amount by gender and age groups
- Sale statistics divided by member seniority level
- Sale amount grouped per department, divided by gender
Columns:
- Section 1
- This year - number of members who joined in the selected date range,
- Last year - number of members who joined the year before selected date range
- Section 2
- Num of receipts
- Avg amount - (Sale amount inc. VAT)/(Num of receipts)
- Items - number of items sold
- Items/Cust - average number of sold items per customer
- Gross profit
- Gross profit % - Share of Gross profit in Sale amount
- Section 3
- Age group
- Sales inc. VAT
- Gross profit
- Gross profit % - Share of Gross profit in Sale amount
- Section 4
- level - member characteristic
- Num of receipts
- Avg amount - (Sale amount inc. VAT)/(Num of receipts)
- Items - number of items sold
- Items/Cust - average number of sold items per customer
- Gross profit
- Gross profit % - Share of Gross profit in Sale amount
- Section 5
- Department - Department name
- Female - Sale amount inc. VAT for scpecific department generated by women
- Female % - Share of sale amount inc. VAT for scpecific department generated by women in all sales inc. VAT across all departments and all genders
- Total -Sale amount inc. VAT for scpecific department
- Total % - Share of sale amount inc. VAT for scpecific department in all sales inc. VAT across all departments
Sorting:
- Section 3 - Age group
- Section 4 - Level
- Section 5 - Department name
Clarifications:
- This year, las year - if date range is 2020/01/01 - 2022-/01/01, then This year is 2020/01/01 - 2022-/01/01 and Last year is 2019/01/01 - 2021/01/01
Source:
- Lindbak POS Reporting cube (OLAP)
- Lindbak POS Reporting DW
CO based on report 0714


Description:
Report allows to follow up article sales on multiple levels with possibility to select specific hourly intervals and exclude specific item groups.
Selections:
- Date from - Default today
- Date to - Default today
- Hour from - Default 0:00
- Hour to - Default 24:00
- Team - Default all
- Store - Default all
- Department - Default all
- Article area - Default all
- Article group - Default all
- Include VAT - Default on
- Exclude groups - Default false
- Excluded groups - Appears when Exclude groups is switched to true
Output:
Article sale statistics for selected stores, for selected date interval and for selected time interval grouped by department, area and group.
By default data is shown for department and it is possible to drill down to item level manually by clicng plus button or by using expand all button to expand everithing to item level at once.
Columns:
- Buttons for expanding and collapsing all drilldowns.
- EAN - EAN code
- Item name - Article name
- Quantity
- Total- Quantity sold
- Turnover inc. VAT or Turnover ex. VAT depending on selection.
- Total - Amount sold. Inc. or ex. VAT depending on selection
- Share - Share of this department / area / group / item related to total sale.
- Cost price - Cost price
- Gross profit
- Total - Gross profit amount
- Total % - Gross profit percentage.
Sorting:
- Department number - age group
- Item Area number -
- Item Group number
- EAN
Clarifications:
- Hour selection applies to each day in selected date period
Source:
- Lindbak POS Reporting cube (OLAP)
CO: 207212. Based on report 0754

Description:
Report allows to find given number of best or worst selling items on multiple levels (amount, quantity, gross profit) in two date intervals. Possible to select specific hourly interval.
Selections:
- Date from - Default today
- Date to - Default today
- Compare date from - Default the same day of week as Date from year before
- Compare date to- Default the same day of week as Date to but year before
- Hour from - Default 0:00
- Hour to - Default 24:00
- Team - Default all
- Store - Default all
- Department - Default all
- Article area - Default all
- Article group - Default all
- Number of items - Number of best or worst items to display - default 10
- Sort type - worst or best - report will display given number of worst or best selling items - default best
- Sort measure - amount/quantity/net cost/gross profit/gross profit % - set the measure on which the items are sorted. - default amount
- Vendor - default all
- Subvendor- default all
- Include VAT - Default on
- Exclude groups - Default false
- Excluded groups - Appears when Exclude groups is switched to true
Output:
Sale statistics for selected number of best or worst items per store sorted by selected sort measure devided in two selected date intervals in selected hour range.
Columns:
- Store
- Dept. - Department
- Area
- Grp. - Item group
- EAN
- Item name
- Quantity
- Turnover ex. VAT
- Gross profit
- Gross profit %
- Num of receipts
Sorting:
- Selected sort measure
Clarifications:
- Hour selection applies to each day in selected date period
Source:
- Lindbak POS Reporting cube (OLAP)
- Lindbak POS Reporting DW
CO: 208778. Based on report 0650

Description:
Report shows credit sales and payments on account to get a better overview over drive-offs.
Selections:
- Date from - Default today
- Date to - Default today
- Team - Default all
- Retail store - Default all available in selected team
Output:
One row per transaction grouped by store and customer. Page break and total for each store.
Columns:
- Date - date of the transaction,
- Receipt - receipt number of the transaction,
- Ref.no - reference number of the credit tender transaction,
- Ref.text - reference text of the credit tender transaction,
- Amount - amount inc. VAT of the credit tender transaction,
- Tax amount - VAT amount from articles,
- On account - payments when using payment on account function in POS.
Sorting:
- Store number
- Customer key
- Transaction date
Clarifications:
Transaction can be either Credit sale or Payment on account. If transaction is Payment on account there is no data available for columns: Ref.no and Ref.text
Source:
- Lindbak POS Reporting DW